在 R 中使用 Python 模块 Mesa 来创建 ABM 模型
使用 R 调用 Mesa 库构建 ABM,模型 demo 完全来源于 Mesa 官方教程, 代码经过轻度改编,持续更新中。
1 准备步骤
1.1 安装 python 环境并安装 mesa
(只需要运行一次)
library(reticulate)
install_miniconda()
conda_create(envname = "mesa-abm", python_version = "3.13.5")
py_install(c("mesa[all]","seaborn"), envname = "mesa-abm", pip = TRUE)
1.2 启动 python 环境
(每次都需要运行)
library(reticulate)
use_condaenv("mesa-abm", required = TRUE)
1.3 导入需要的 python 模块
import mesa
import seaborn as sns
import numpy as np
import pandas as pd
import matplotlib.pyplot as plt
2 模型示例: Boltzmann 财富模型
在这个模型中,每个 Agent 会初始化 1 个单位的货币,并在每个 step 中随机给另一个 Agent 1 个单位的货币。
2.1 创建 Agent 类
Mesa 会自动为每个创建的 Agent 分配一个整数作为 unique_id。
下面这段代码创建了一个新类 (class) MoneyAgent,继承了 mesa.Agent 类的属性。
mesa.Agent 是 Mesa 模块中定义的一个基类,所有的 Agent 都应该继承这个类。
class MoneyAgent(mesa.Agent):
    """An agent with fixed initial wealth."""

    # 初始化,每次使用 MoneyAgent 创建新对象时都会使用如下初始化
    def __init__(self, model): # self代表当前对象,model 代表模型对象

        # 将父类中的参数 model (mesa.Agent) 传入,让Agent知道自己所属的模型
        super().__init__(model)

        # 创建 Agent 的变量 wealth 并设置初始值
        self.wealth = 1
2.2 创建模型类
创建一个模型类,继承自 mesa.Model,负责创建、保存和管理所有 Agent。
class MoneyModel(mesa.Model):
    """A model with some number of agents."""

    def __init__(self, n, seed=None): # n 是创建的 Agent 数量,seed 是随机种子
        super().__init__(seed=seed)
        # 在self (即当前模型) 中创建一个属性 num_agents,保存 Agent 的数量
        self.num_agents = n
        # 调用类方法 create_agents,创建 n 个 Agent
        MoneyAgent.create_agents(model=self, n=n)
2.3 让 Agents “do”
通过 do 让 ABM 运行起来,mesa 中的 do 可以按不同的顺序激活 Agent。
在每一个 step 中,(通常) 每一个 Agent 都会被激活并采取自己的行动,在内部发生变化和/或与彼此或者环境交互。
此处使用 agent.shuffle_do() 来实现随机重新排序激活顺序。
class MoneyAgent(mesa.Agent):
    """An agent with fixed initial wealth."""

    def __init__(self, model):
        super().__init__(model)
        self.wealth = 1
        # 以上代码同上

        # 定义一个方法 say_hi,每个 step 中都会被调用
    def say_hi(self):
        # 为了演示,输出了每个 Agent 的 unique_id
        print(f"Hi, I am an agent, you can call me {str(self.unique_id)}.")


class MoneyModel(mesa.Model):
    """A model with some number of agents."""

    def __init__(self, n, seed=None):
        super().__init__(seed=seed)
        self.num_agents = n

        MoneyAgent.create_agents(model=self, n=n)
        # 以上代码同上

    # 定义模型的 step 方法
    def step(self):
        """Advance the model by one step."""

        # 随机重新排序 Agent 的激活顺序,并调用每个 Agent 的 say_hi 方法
        self.agents.shuffle_do("say_hi")
2.3.1 运行模型
创建一个模型对象 (object) 并运行它的 step 方法。
# 创建模型对象 starter_model,使用 MoneyModel 类
# 此处的 10 对应 MoneyModel 类的第二个参数 n,表示创建 10 个 Agent
starter_model = MoneyModel(10)

# 运行模型的 step 方法,激活所有 Agent
starter_model.step()
Hi, I am an agent, you can call me 1.
Hi, I am an agent, you can call me 7.
Hi, I am an agent, you can call me 6.
Hi, I am an agent, you can call me 3.
Hi, I am an agent, you can call me 9.
Hi, I am an agent, you can call me 4.
Hi, I am an agent, you can call me 2.
Hi, I am an agent, you can call me 5.
Hi, I am an agent, you can call me 10.
Hi, I am an agent, you can call me 8.如果在创建对象时传入了 seed 参数,则每次运行模型时 Agent 的顺序会保持一致。
starter_model = MoneyModel(10, seed = 1234)
starter_model.step()
Hi, I am an agent, you can call me 3.
Hi, I am an agent, you can call me 9.
Hi, I am an agent, you can call me 4.
Hi, I am an agent, you can call me 6.
Hi, I am an agent, you can call me 7.
Hi, I am an agent, you can call me 5.
Hi, I am an agent, you can call me 10.
Hi, I am an agent, you can call me 1.
Hi, I am an agent, you can call me 2.
Hi, I am an agent, you can call me 8.2.3.2 模型修改练习
在原有模型的基础上,让 Agent 在激活时输出自己的 wealth。
class MoneyAgent(mesa.Agent):
    """An agent with fixed initial wealth."""

    def __init__(self, model):
        super().__init__(model)

        self.wealth = 1

    # 定义 say_wealth 方法,输出 Agent 的 wealth
    def say_wealth(self):
        print(f"Hi, I am an agent {self.unique_id},"
              f"and I have {self.wealth} dollars.")

class MoneyModel(mesa.Model):
    """A model with some number of agents."""

    def __init__(self, n, seed=None):
        super().__init__(seed=seed)
        self.num_agents = n

        MoneyAgent.create_agents(model=self, n=n)

    def step(self):
        """Advance the model by one step."""

        self.agents.shuffle_do("say_wealth")

starter_model = MoneyModel(10)
starter_model.step()
Hi, I am an agent 4,and I have 1 dollars.
Hi, I am an agent 6,and I have 1 dollars.
Hi, I am an agent 1,and I have 1 dollars.
Hi, I am an agent 10,and I have 1 dollars.
Hi, I am an agent 2,and I have 1 dollars.
Hi, I am an agent 8,and I have 1 dollars.
Hi, I am an agent 3,and I have 1 dollars.
Hi, I am an agent 5,and I have 1 dollars.
Hi, I am an agent 7,and I have 1 dollars.
Hi, I am an agent 9,and I have 1 dollars.2.4 Agents 交换财富
class MoneyAgent(mesa.Agent):
    """An agent with fixed initial wealth."""

    def __init__(self, model):
        super().__init__(model)
        self.wealth = 1

    # 定义 exchange 方法,让 Agent 交换财富
    def exchange(self):
        if self.wealth > 0: # 有钱才能转账
            # self.random, 是继承自 mesa.Agent 的随机数生成器
            # .choice(...) 在列表中随机选择一个 Agent
            # 这里的self.model是在上一步—__init__中传入的模型对象
            other_agent = self.random.choice(self.model.agents)

            if other_agent is not None: # 确保选到了一个 Agent
                other_agent.wealth += 1
                self.wealth -= 1


class MoneyModel(mesa.Model):
    """A model with some number of agents."""

    def __init__(self, n, seed=None):
        super().__init__(seed = seed)
        self.num_agents = n

        MoneyAgent.create_agents(model=self, n=n)

    def step(self):
        """Advance the model by one step."""

        self.agents.shuffle_do("exchange")
2.4.1 运行模型
model = MoneyModel(10, 1234)  # 创建 10 个 Agents

# 这个 for 循环中 _ 是一个占位符
# 表示我们不关心循环变量的值,也不关心现在运行了几次,只是想运行30次
for _ in range(30):
    model.step()
2.4.2 可视化
# 获取每个 Agent 的 wealth,放入一个列表
agent_wealth = [a.wealth for a in model.agents]
# 绘制直方图
g = sns.histplot(agent_wealth, discrete=True)
g.set(
    title="Wealth distribution", xlabel="Wealth", ylabel="number of agents"
);
plt.show()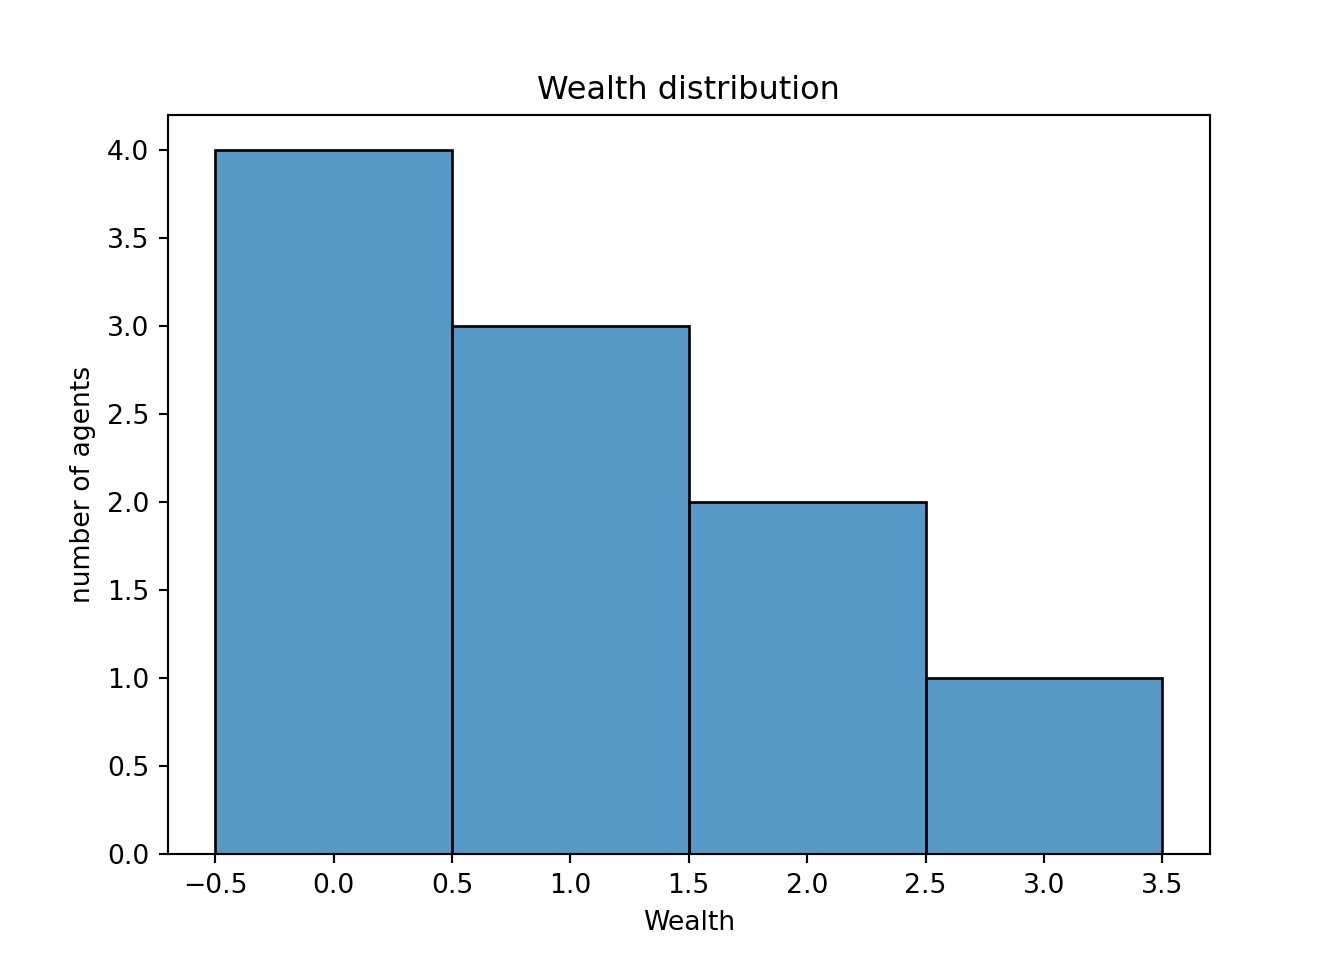
2.4.2.1 传入 R 中用 ggplot2 可视化
library(tidyverse)── Attaching core tidyverse packages ──────────────────────── tidyverse 2.0.0 ──
✔ dplyr 1.1.4 ✔ readr 2.1.5
✔ forcats 1.0.0 ✔ stringr 1.5.1
✔ ggplot2 3.5.2 ✔ tibble 3.3.0
✔ lubridate 1.9.4 ✔ tidyr 1.3.1
✔ purrr 1.0.4
── Conflicts ────────────────────────────────────────── tidyverse_conflicts() ──
✖ dplyr::filter() masks stats::filter()
✖ dplyr::lag() masks stats::lag()
ℹ Use the conflicted package (<http://conflicted.r-lib.org/>) to force all conflicts to become errors# 使用 iterate 函数遍历 model 中的 agents
agent_wealth <- map_dbl(iterate(py$model$agents), "wealth") %>%
tibble(wealth = .)
ggplot(agent_wealth, aes(x = wealth)) +
geom_histogram(binwidth = 1, boundary = 0, closed = "left",
color = "black", fill="red") +
labs(
title = "Wealth distribution",
x = "Wealth",
y = "Number of agents"
)+ theme_bw()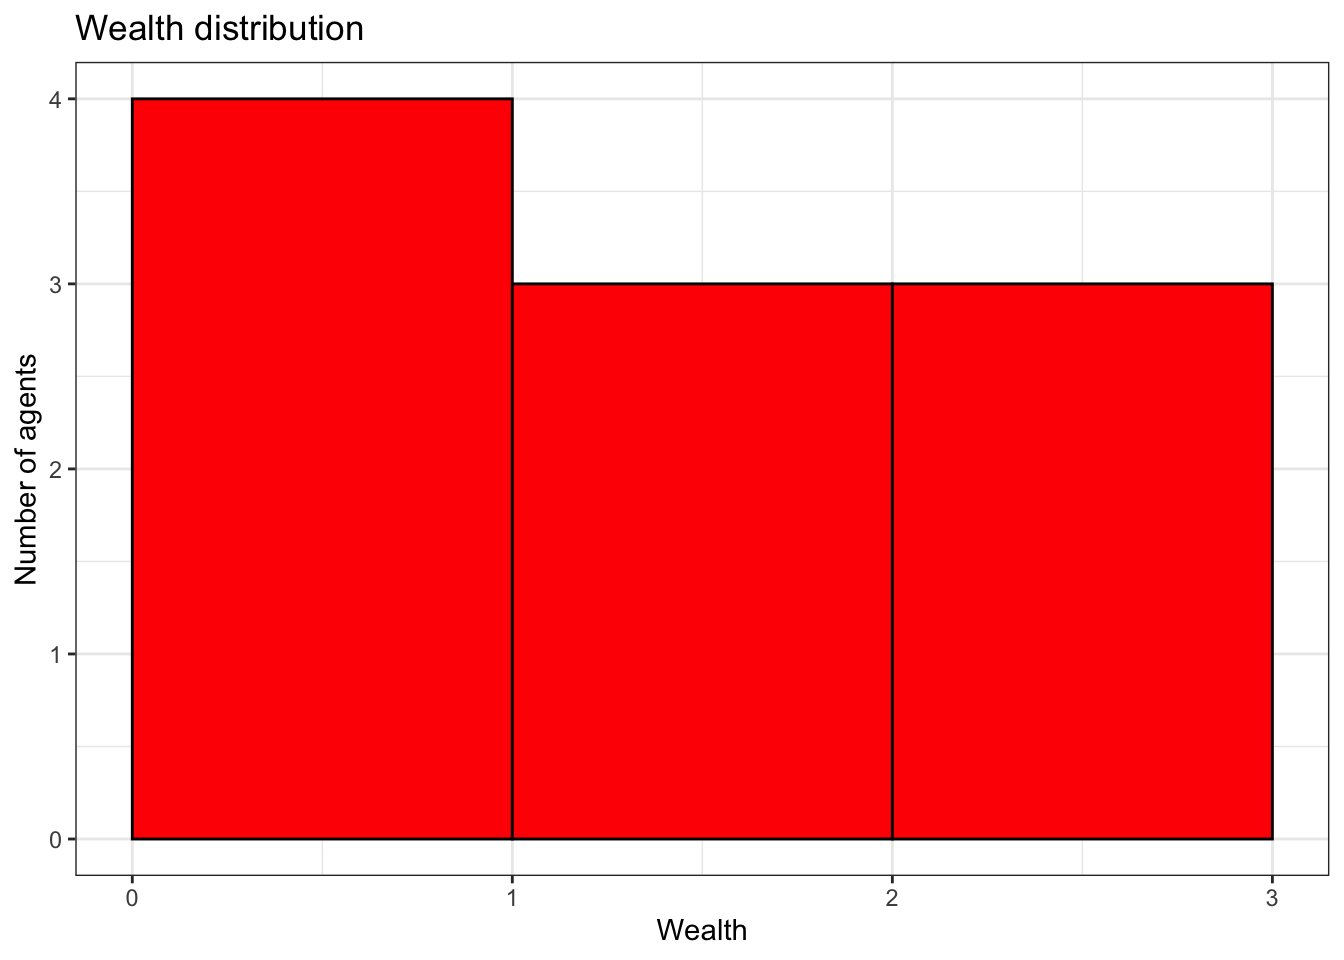
2.4.3 创建多个模型对象
为了更好地理解模型行为,可以创建多个模型对象,以观察整体分布。
# 创建一个空列表来存储循环结果,与 R 中类似,可以使循环运行更快
all_wealth = []
# 运行 100 次模型,每个模型有 10 个 Agent,并运行 30 次 step
for _ in range(100):
    model = MoneyModel(10)
    for _ in range(30):
        model.step()
    # 注意这里的缩进,说明下面这个循环是在for _ in range(100):循环中
    # 这样每次运行一个模型就会存储所有 Agent 的 wealth
    for agent in model.agents:
        # 注意这里使用了就地扩展 (append), 即直接向 all_wealth 列表添加元素
        # 这是python的一个特性,直接在list后增加元素不是一个复杂的计算
        all_wealth.append(agent.wealth)

g = sns.histplot(all_wealth, discrete=True)
g.set(title="Wealth distribution", xlabel="Wealth", ylabel="number of agents");
plt.show()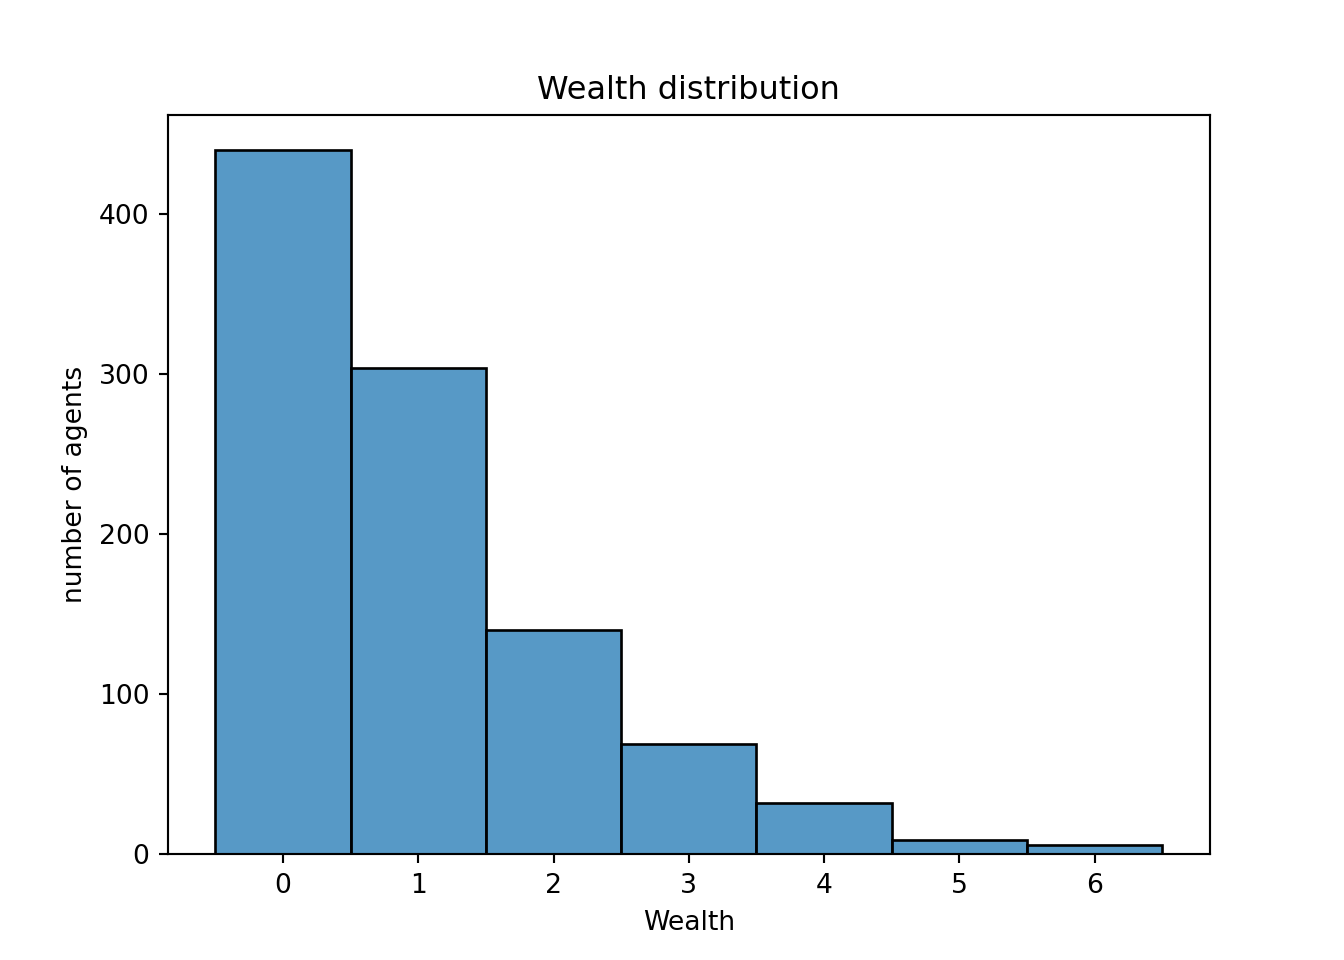
2.4.3.1 在 R 中运行模型
models <- map(1L:100L, ~{
  model <- py$MoneyModel(10L)
  walk(1L:30L, ~ model$step())
  model
})

all_wealth <- map_dfr(models,
                      ~map_dbl(iterate(.x$agents), "wealth") %>%
                        tibble(wealth = .))

ggplot(all_wealth, aes(x = wealth)) +
  geom_histogram(binwidth = 1, boundary = 0, closed = "left",
                 color = "black", fill="red") +
  labs(
    title = "Wealth distribution",
    x     = "Wealth",
    y     = "Number of agents"
  )+ theme_bw()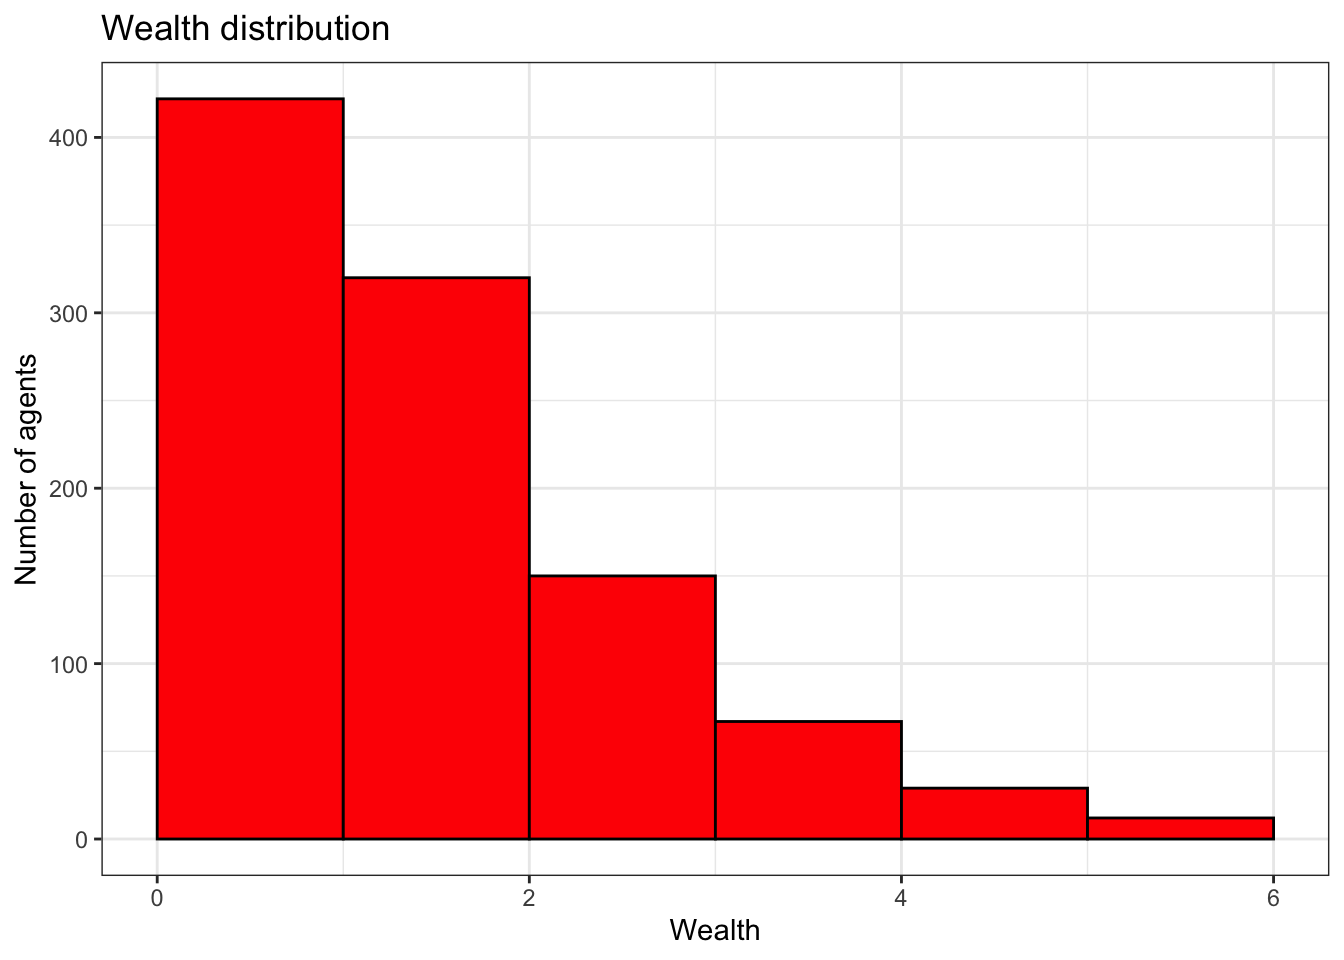
3 添加空间
3.1 基础模型
以下模型即上述财富模型。
class MoneyAgent(mesa.Agent):
    """An agent with fixed initial wealth."""

    def __init__(self, model):
        super().__init__(model)
        self.wealth = 1

    def exchange(self):
        if self.wealth > 0:
            other_agent = self.random.choice(self.model.agents)
            if other_agent is not None:
                other_agent.wealth += 1
                self.wealth -= 1


class MoneyModel(mesa.Model):
    """A model with some number of agents."""

    def __init__(self, n):
        super().__init__()
        self.num_agents = n
        MoneyAgent.create_agents(model=self, n=n)

    def step(self):
        """Advance the model by one step."""
        self.agents.shuffle_do("exchange")
model = MoneyModel(10)
model.step()
print(f"You have {len(model.agents)} agents.")You have 10 agents.3.2 空间概念
Mesa 提供两种空间类型:离散空间和连续空间。
离散空间:
Agent占据单元格或节点连续空间:
Agent占据三维空间中的任何位置
以下使用经典笛卡尔坐标系下的离散空间,具有两个模块:单元格 (cell) 和单元格 Agent。
单元格类表示一个具备以下功能的位置:
具有属性 (如温度、资源等)
追踪并限制其包含的
Agent与相邻单元格连接
提供邻居 (
neighborhood) 的信息
单元格 Agent 类:能够理解如何在单元格中存在和移动的 Agent。
CellAgent: 可以在单元格间移动的Agent。FixedAgent: 永久固定在单元格上的静止Agent。Grid2DMovingAgent: 具有特定网格移动能力的Agent。
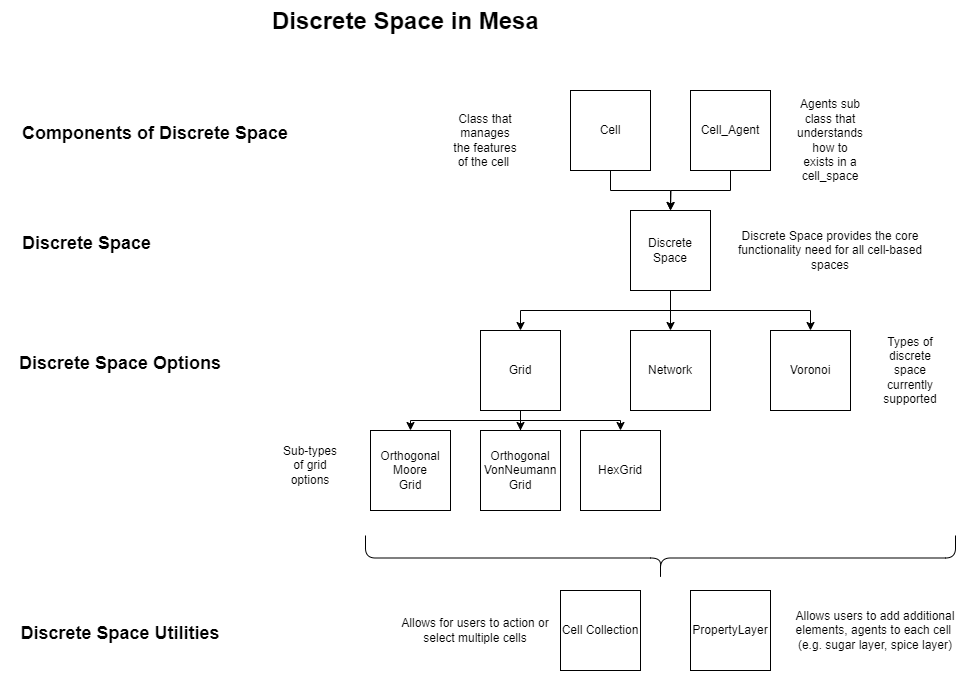
网格 (
Grid): 规则多边形摩尔邻域 (
Moore Grid):每个单元格的八个相邻单元格。冯诺依曼邻域 (
Von Neumann Grid):每个单元格的四个相邻单元格。六边形 (
Hex Grid):每个单元格的六个相邻单元格。
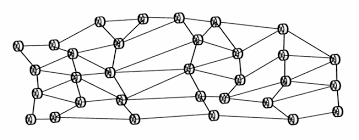
网络 (
Network): 每个格点是图中的一个节点,连接关系由边(edge)定义,适合社交网络、通信拓扑等场景。
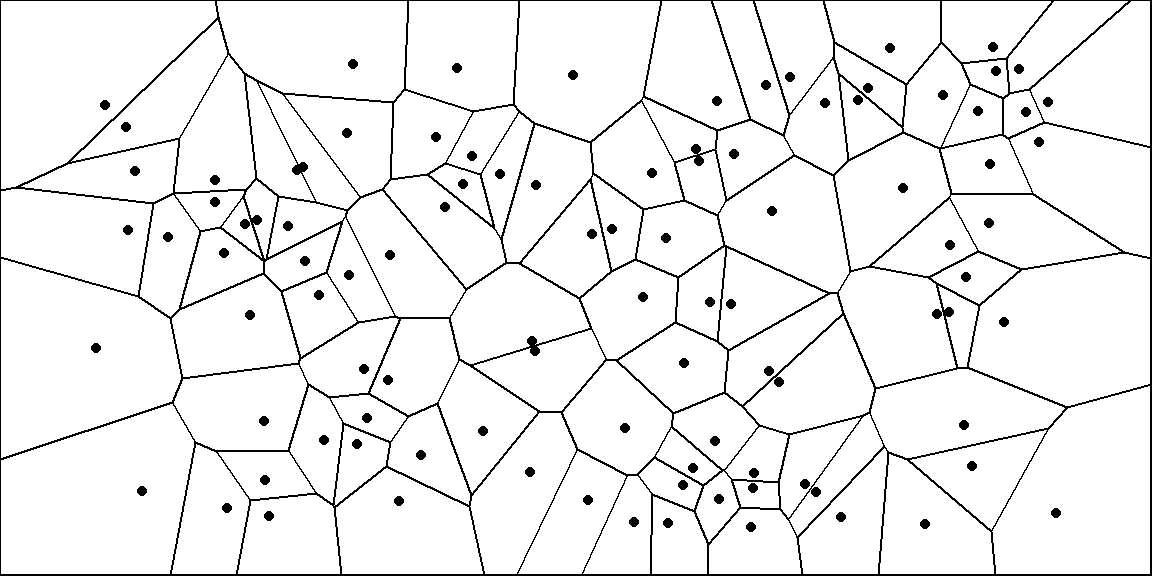
Voronoi: 不规则多边形划分空间:给定一组中心点,每块多边形就是一个Cell,适用于地理空间等不规则网格情形。
3.3 代码实现
3.3.1 创建 CellAgent
为了使模型具有离散空间功能,我们将 MoneyAgent 实例化为 CellAgent。
CellAgent 是 Agent 的一个子类,专门用于在离散空间 discrete space 模块中交互和移动。
# 下面这行import相当于只从 mesa.discrete_space 中导入
# CellAgent 和 OrthogonalMooreGrid 这两个类,如果此处导入
# 那么下面使用时不需要写明 mesa.discrete_space.CellAgent
# 而可以直接使用CellAgent,类似R中 dplyr::select 和 library(dplyr)
# from mesa.discrete_space import CellAgent, OrthogonalMooreGrid

# 使用父类 CellAgent 来创建一个新的 Agent 类 MoneyAgent
class MoneyAgent(mesa.discrete_space.CellAgent):
    """An agent with fixed initial wealth."""

    def __init__(self, model, cell):
        super().__init__(model)
        self.cell = cell  # 将 Agent 初始化在 (x,y),这个位置由参数 cell 决定
        self.wealth = 1

    # 定义移动函数,控制 Agent 在单元格中移动
    def move(self):
        # 选择一个随机的相邻单元格,默认半径为 1
        self.cell = self.cell.neighborhood.select_random_cell()

    # 定义交换财富函数
    def give_money(self):
        # 选择同一个单元格内所有非本身的 Agent
        cellmates = [
            a for a in self.cell.agents if a is not self
        ]
        # 如果自己的财富 >0, 切存在同格内的其他 Agent
        if self.wealth > 0 and cellmates:
            # 在所有同格内的 Agent 中随机选择一个
            other_agent = self.random.choice(cellmates)
            # 将自己的财富 -1,选中的 Agent 的财富 +1
            other_agent.wealth += 1
            self.wealth -= 1
3.3.2 创建模型类
class MoneyModel(mesa.Model):
    """A model with some number of agents."""

    def __init__(self, n, width, height, seed=None):
        super().__init__(seed=seed)
        self.num_agents = n
        # 创建一个摩尔邻域 (每个单元格有 4 个邻居) 网格
        self.grid = mesa.discrete_space.OrthogonalMooreGrid(
            # 长宽参数由外部传入,torus控制启用周期性边界
            # 即最右边和最左边相接,上下相接
            # 每个单元格最大可以容纳 10 个 Agent
            (width, height), torus=True, capacity=10, random=self.random
        )

        # 创建 Agent,这里和前面的模型不一样,新建的 Agent 被存入了列表 agents
        # 因为立刻要对 agents 进行操作,要将其保存
        # 如果直接调用 create_agents,模型中存在的是旧的+新建的 agents
        # 如下写,每次都会覆盖 agents
        agents = MoneyAgent.create_agents(
            self, # model = self
            self.num_agents, # n = self.num_agents
            # 给每个 Agent 分配一个随机的单元格
            # 从所有单元格中挑 k 次,k = Agent 的数量
            self.random.choices(self.grid.all_cells.cells, k=self.num_agents),
        )

    # 定义 step,每步运行一次移动和一次给钱
    def step(self):
        self.agents.shuffle_do("move")
        self.agents.do("give_money")
3.3.3 运行模型
在一个 10x10 的网格上创建一个包含 100 个智能体的模型,并运行 20 步。
model = MoneyModel(100, 10, 10, 1234)
for _ in range(20):
    model.step()
3.3.4 可视化
agent_counts = np.zeros((model.grid.width, model.grid.height))

for cell in model.grid.all_cells:
    agent_counts[cell.coordinate] = len(cell.agents)

g = sns.heatmap(agent_counts, cmap="viridis", annot=True, cbar=False, square=True)
g.figure.set_size_inches(5, 5)
g.set(title="Number of agents on each cell of the grid");
plt.show()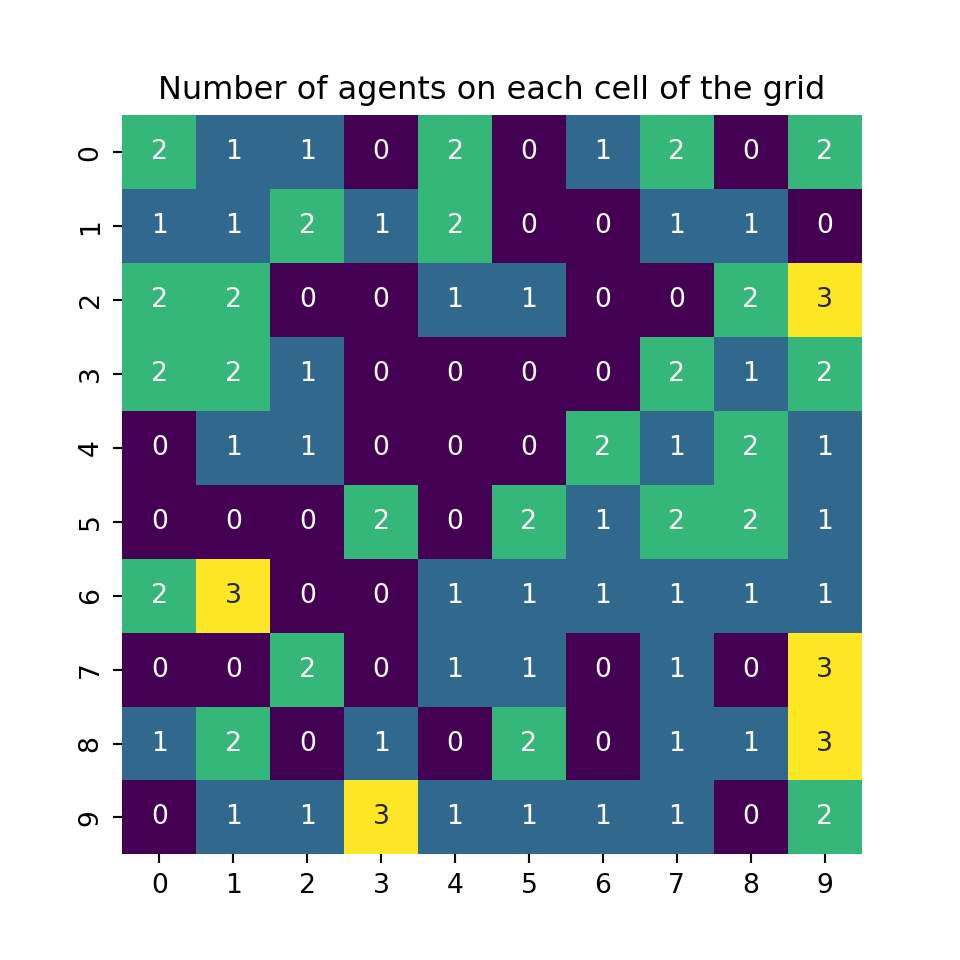
3.3.4.1 用 R 运行模型
使用 ggplot2 手动绘制。
library(tidyverse)

model = py$MoneyModel(100L, 10L, 10L, 1234L)
walk(1:20L, ~model$step())

agent_counts <- map_dfr(
  iterate(model$grid$all_cells),
  ~{
    coord <- as.numeric(.x$coordinate)
    tibble(
      col   = coord[1],
      row   = coord[2],
      count = length(.x$agents)
    )
  }
)

ggplot(agent_counts,aes(col, row, fill = count, label = count)) +
  geom_tile() +
  geom_text(color = "white") +
  scale_fill_viridis_c(option = "viridis") +
  scale_x_continuous(breaks = seq(min(agent_counts$col),
                                  max(agent_counts$col), by = 1),
                     expand = c(0,0)) +
  scale_y_reverse(breaks = seq(min(agent_counts$row),
                               max(agent_counts$row), by = 1),
                     expand = c(0,0)) +
  coord_fixed() +
  theme_minimal() +
  ggtitle("Number of agents on each cell of the grid") +
  theme(
    legend.position = "none",
    plot.title = element_text(hjust = 0.5)
  ) +
  labs(x = NULL, y = NULL)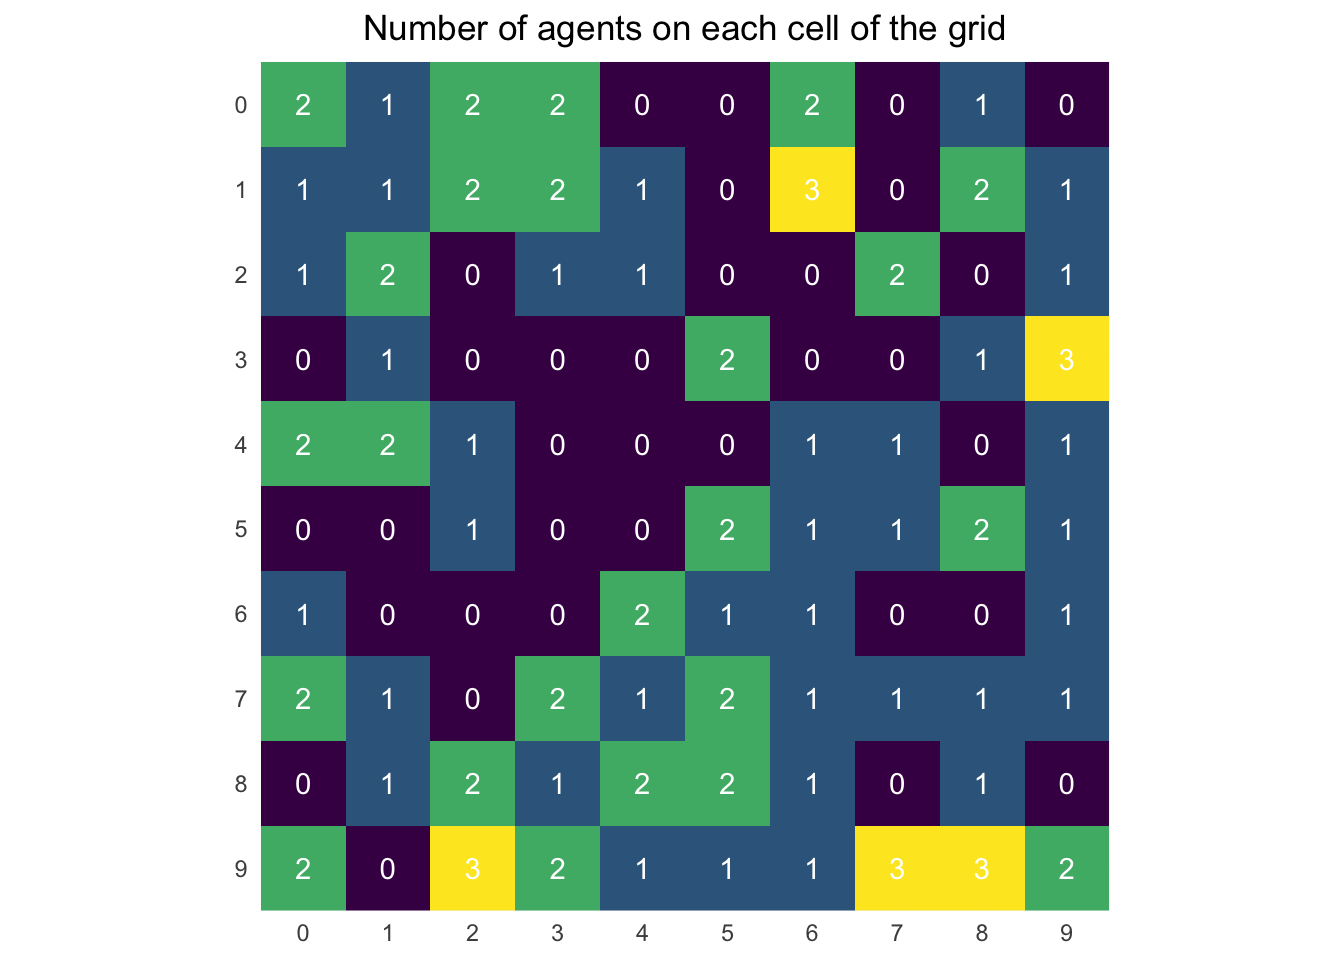
或者调用一些更方便的包,如 tidyheatmaps。
library(tidyheatmaps)
tidyheatmap(agent_counts, row, col, count, colors = viridis::viridis(100),
            display_numbers = T, number_format = "%.0f", number_color = "white",
            fontsize_number = 10,legend = F,cellwidth = 30, cellheigh = 30,
            angle_col = 0,
            main = "Number of agents on each cell of the grid")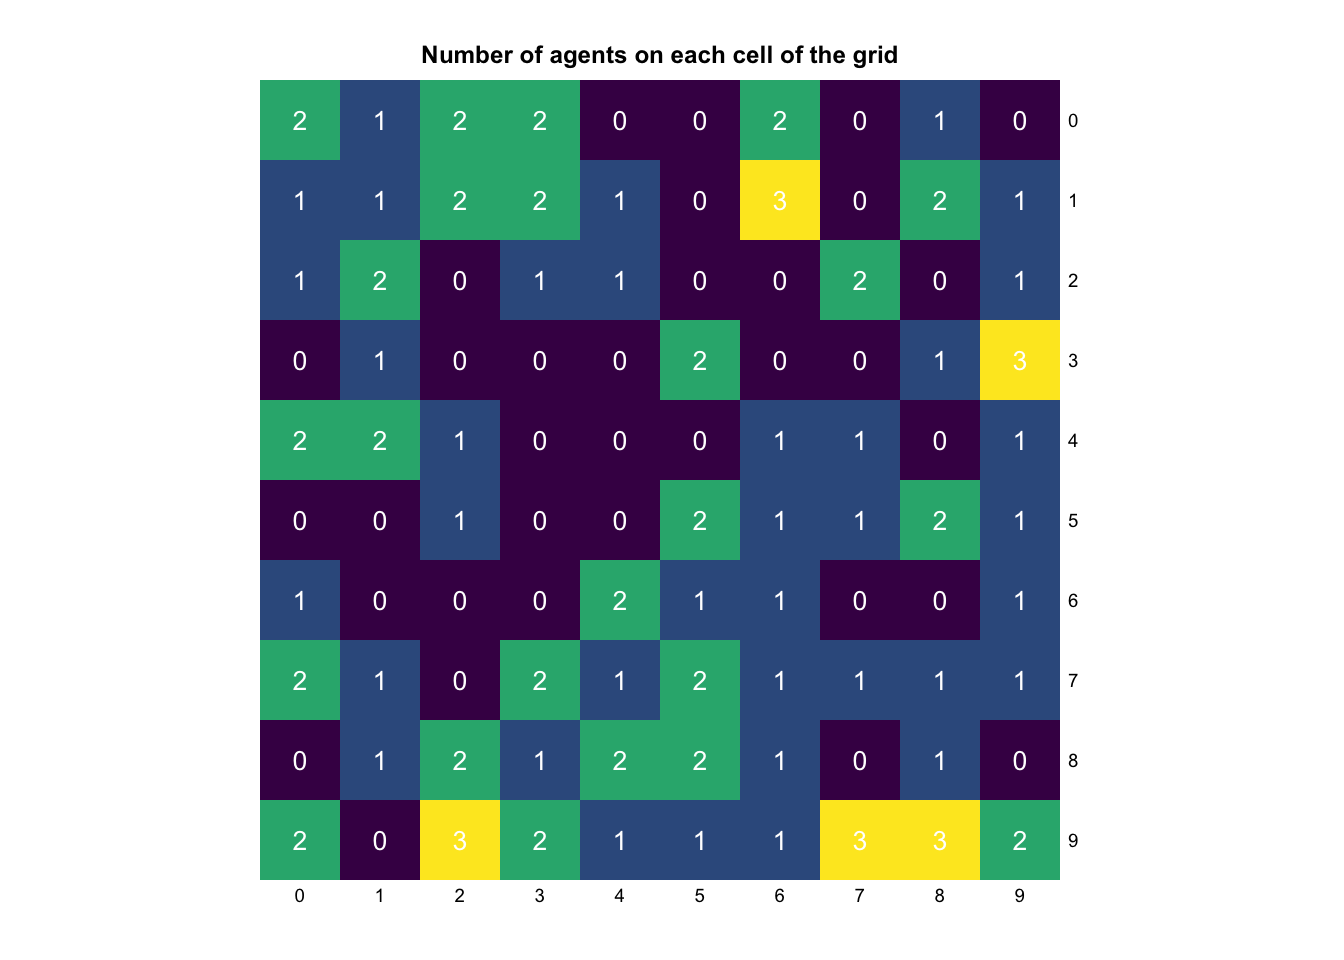
3.3.5 模型修改练习
3.3.5.1 改变网格尺寸
将网格尺寸从 10x10 改为 20x20,并运行模型。
model = py$MoneyModel(100L, 20L, 20L, 1234L)
walk(1:20L, ~model$step())

agent_counts <- map_dfr(
  iterate(model$grid$all_cells),
  ~{
    coord <- as.numeric(.x$coordinate)
    tibble(
      col   = coord[1],
      row   = coord[2],
      count = length(.x$agents)
    )
  }
)

tidyheatmap(agent_counts, row, col, count, colors = viridis::viridis(100),
            display_numbers = T, number_format = "%.0f", number_color = "white",
            fontsize_number = 10,legend = F,cellwidth = 15, cellheigh = 15,
            angle_col = 0,
            main = "Number of agents on each cell of the grid")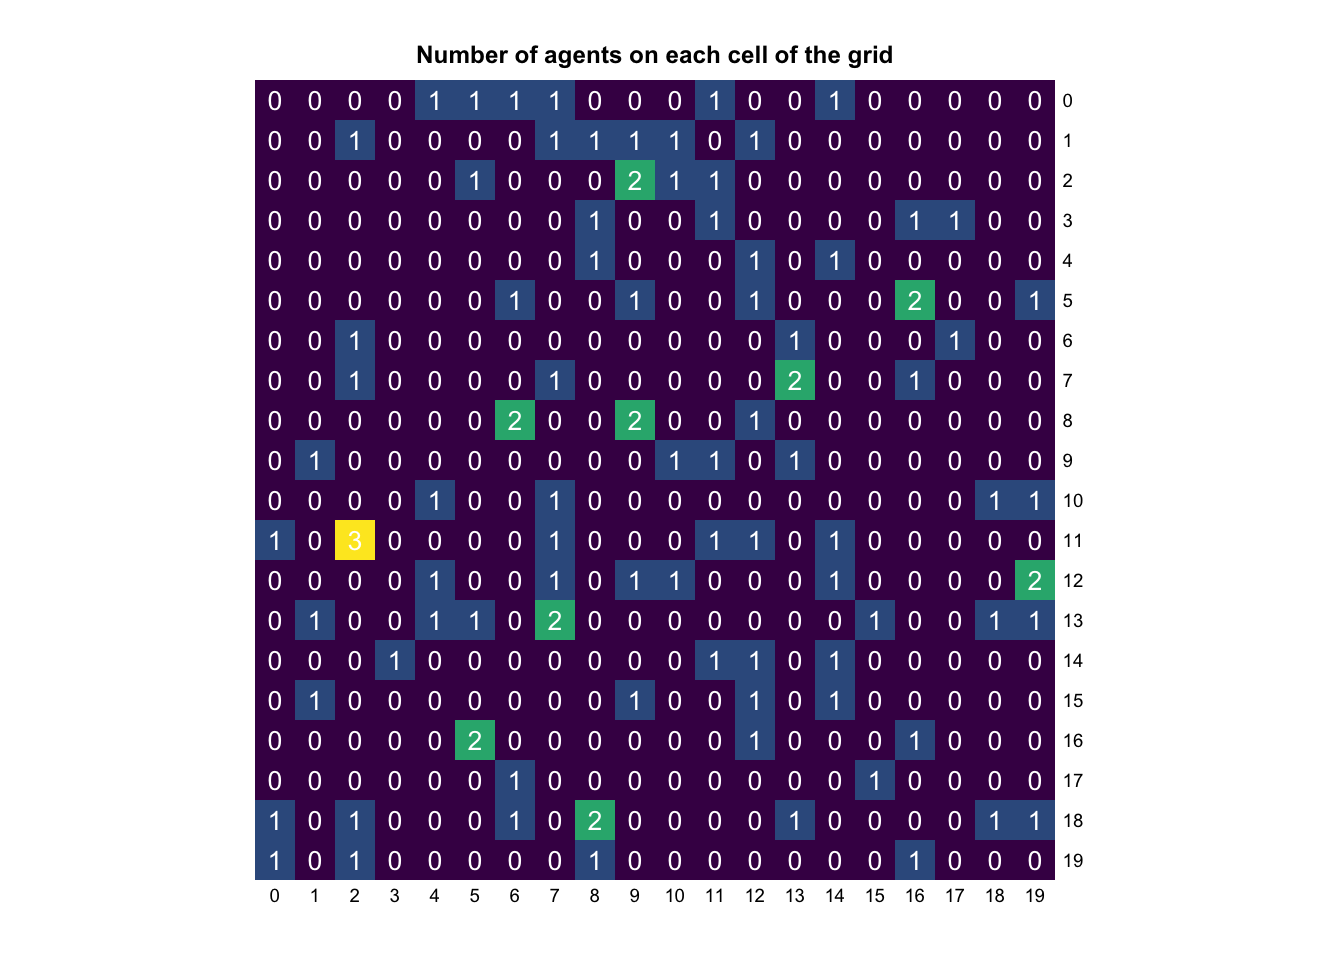
3.3.5.2 改变单元格容量
将单元格容量从 10 改为 3,并运行模型。
model = py$MoneyModel(100L, 10L, 10L, 1234L)
model$grid$capacity = 3L
walk(1:20L, ~model$step())

agent_counts <- map_dfr(
  iterate(model$grid$all_cells),
  ~{
    coord <- as.numeric(.x$coordinate)
    tibble(
      col   = coord[1],
      row   = coord[2],
      count = length(.x$agents)
    )
  }
)

tidyheatmap(agent_counts, row, col, count, colors = viridis::viridis(100),
            display_numbers = T, number_format = "%.0f", number_color = "white",
            fontsize_number = 10,legend = F,cellwidth = 30, cellheigh = 30,
            angle_col = 0,
            main = "Number of agents on each cell of the grid")
3.3.5.3 改为正交冯诺依曼
将网格从摩尔邻域改为正交冯诺依曼邻域。
class MoneyModel(mesa.Model):
    """A model with some number of agents."""

    def __init__(self, n, width, height, seed=None):
        super().__init__(seed=seed)
        self.num_agents = n
        self.grid = mesa.discrete_space.OrthogonalVonNeumannGrid(
            (width, height), torus=True, capacity=10, random=self.random
        )

        agents = MoneyAgent.create_agents(
            self,
            self.num_agents,
            self.random.choices(self.grid.all_cells.cells, k=self.num_agents),
        )

    def step(self):
        self.agents.shuffle_do("move")
        self.agents.do("give_money")
model = py$MoneyModel(100L, 10L, 10L, 1234L)
walk(1:20L, ~model$step())
agent_wealth <- map_dbl(iterate(py$model$agents), "wealth") %>%
tibble(wealth = .)
ggplot(agent_wealth, aes(x = wealth)) +
geom_histogram(binwidth = 1, boundary = 0, closed = "left",
color = "black", fill="red") +
labs(
title = "Wealth distribution",
x = "Wealth",
y = "Number of agents"
)+ theme_bw()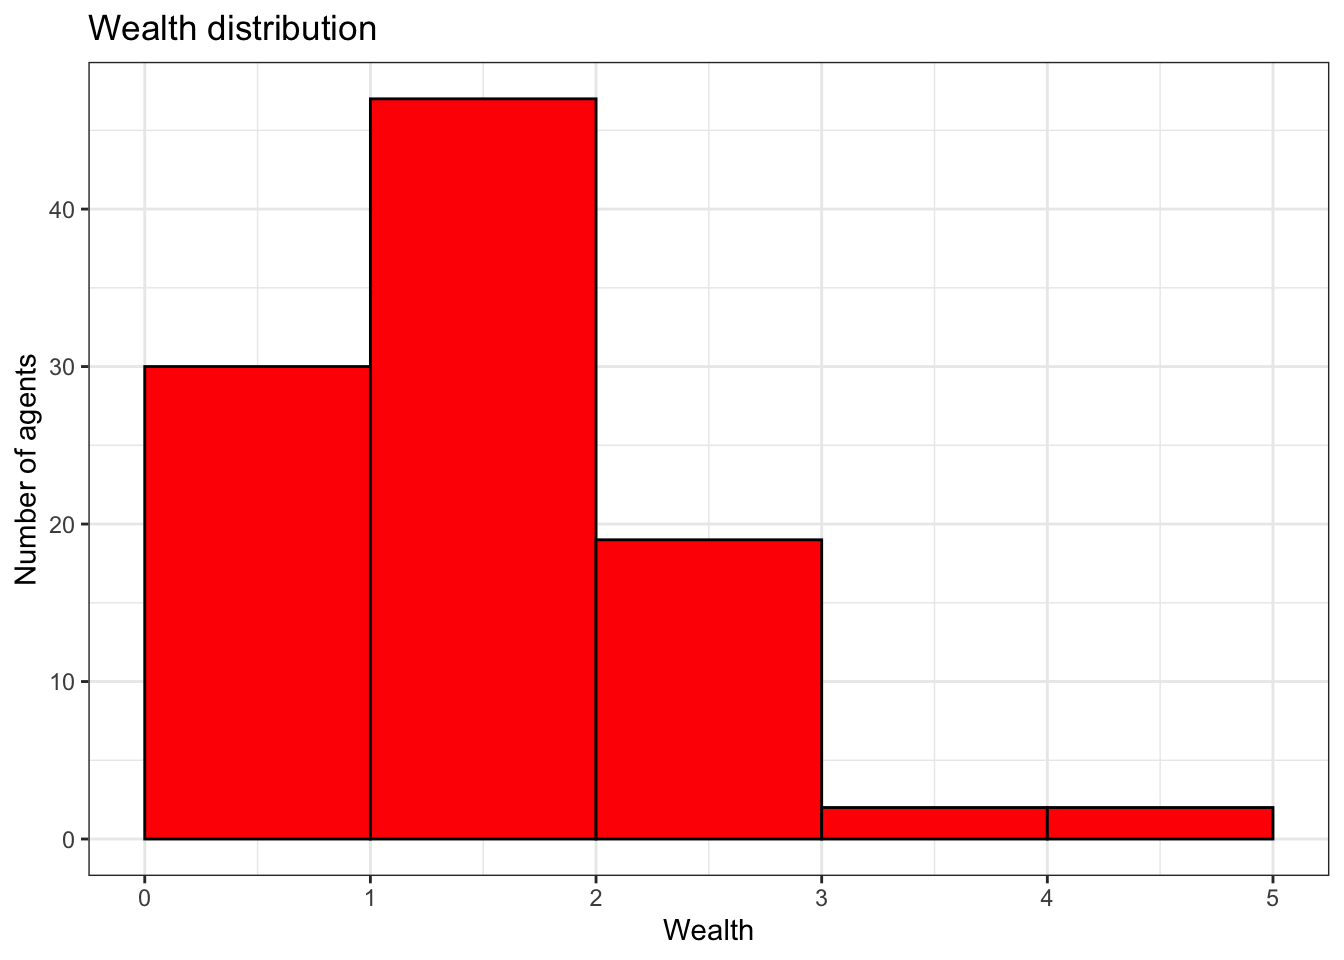
4 一些个人总结
在 Mesa 中,重要的类有两种:
mesa.Agent: 所有的Agent都应该继承这个类。在这个类中会对每个
Agent进行初始化,分配一个唯一的unique_id。初始化 (即定义
__init__) 时会传入模型对象model,让Agent知道自己所属的模型。初始化时还会设置一些
Agent的属性,如wealth。在这个类中还需要定义
Agent的行为方法,如say_hi、exchange等。
mesa.Model: 所有的模型都应该继承这个类。在这个类中会对模型进行初始化,创建模型的属性,如
num_agents、grid等。初始化时会调用
Agent的创建方法,create_agents,来创建模型中的Agent,并初始化Agent的位置。在
step方法中会调用所有Agent的行为方法。
5 数据收集
5.1 创建 model-level 数据收集
from mesa.discrete_space import CellAgent, OrthogonalMooreGrid
def compute_gini(model):
  agent_wealth = [agent.wealth for agent in model.agents]
  x = sorted(agent_wealth)
  n = model.num_agents
  # 计算基尼系数
  B = sum(xi * (n - i) for i, xi in enumerate(x)) / sum(x)
  # !!!注意这里,python不会自动返回最后一个值,必须显式返回
  return 1 + (1 / n) - 2 * B

class MoneyAgent(CellAgent):
  def __init__(self, model, cell):
    super().__init__(model)
    self.cell = cell
    self.wealth = 1
  def move(self):
    self.cell = self.cell.neighborhood.select_random_cell()
  def give_money(self):
    cellmates = [a for a in self.cell.agents if a is not self]
    if self.wealth > 0 and cellmates:
      other_agent = self.random.choice(cellmates)
      other_agent.wealth += 1
      self.wealth -= 1

class MoneyModel(mesa.Model):
  def __init__(self, n, width, height, seed = None):
    super().__init__(seed = seed)
    self.num_agents = n
    self.grid = OrthogonalMooreGrid(
        (width, height), torus=True, capacity=10, random=self.random
    )
    # 实例化数据收集器 (DataCollector)
    self.datacollector = mesa.DataCollector(
      model_reporters = {"Gini": compute_gini},
      agent_reporters = {"Wealth": "wealth"}
    )
    agents = MoneyAgent.create_agents(
      self,
      self.num_agents,
      self.random.choices(self.grid.all_cells.cells, k = self.num_agents)
    )
  def step(self):
    # 在每个 step 中收集数据
    self.datacollector.collect(self)
    self.agents.shuffle_do("move")
    self.agents.do("give_money")
5.2 获取 model_level 数据
model = MoneyModel(100, 10, 10, 1234)
for _ in range(100):
    model.step()

gini = model.datacollector.get_model_vars_dataframe()
g = sns.lineplot(data=gini)
g.set(title="Gini Coefficient over Time", ylabel="Gini Coefficient");
plt.show()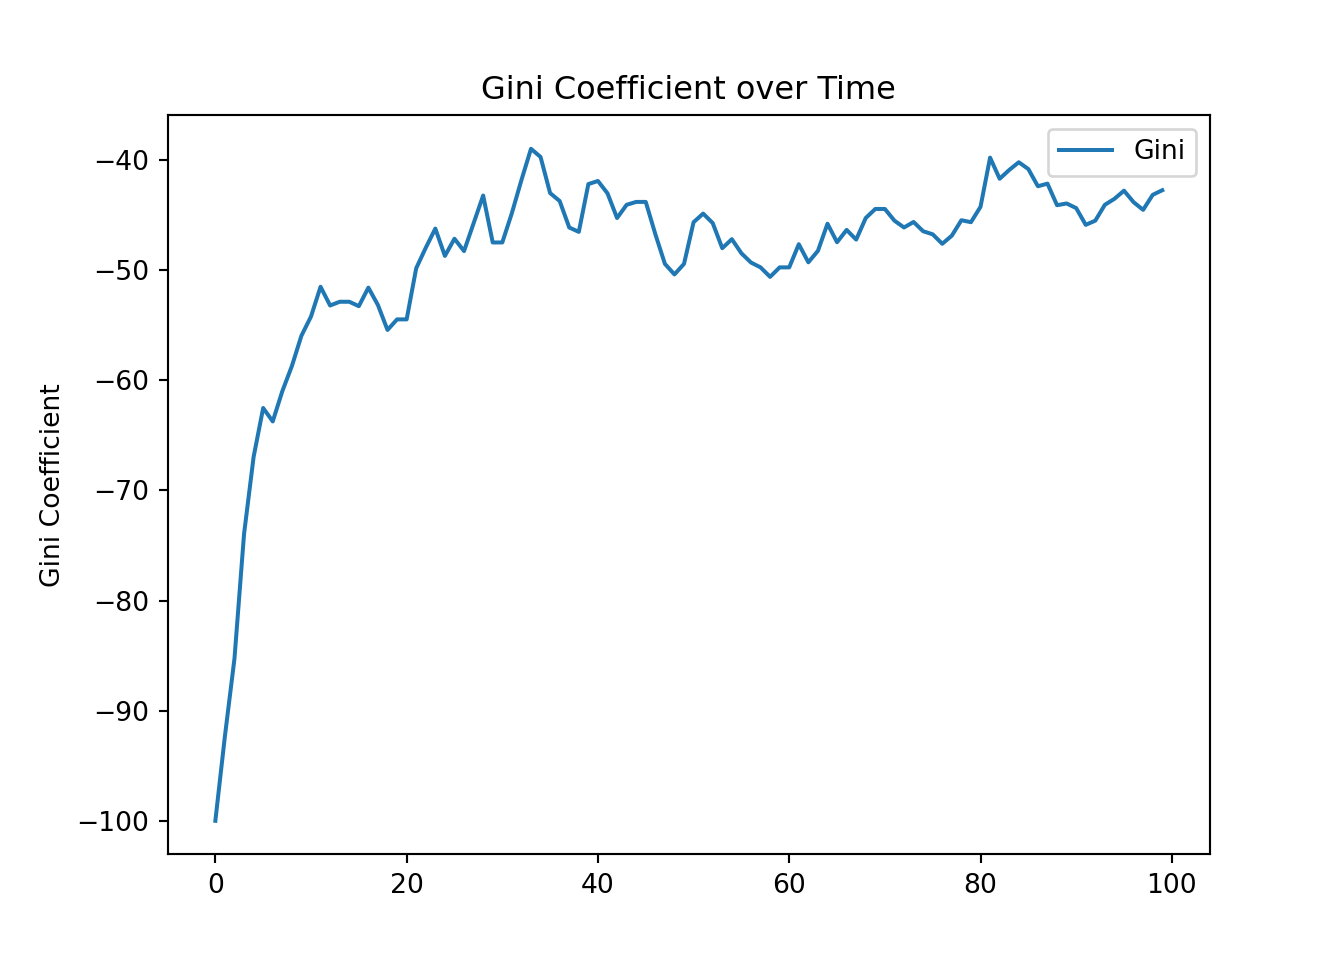
5.2.1 在 R 中运行模型
model = py$MoneyModel(100L, 10L, 10L, 1234L)
walk(1:100L, ~model$step())

# 可以直接这样调用 python 的 function
gini = model$datacollector$get_model_vars_dataframe()  %>%
  rownames_to_column("step") %>% mutate(step = as.numeric(step))
gini %>%
  ggplot(aes(x = step, y = Gini)) +
  geom_line(color = "steelblue") +
  labs(
    title = "Gini Coefficient over Time",
    x     = "Step",
    y     = "Gini Coefficient"
  ) + theme_bw()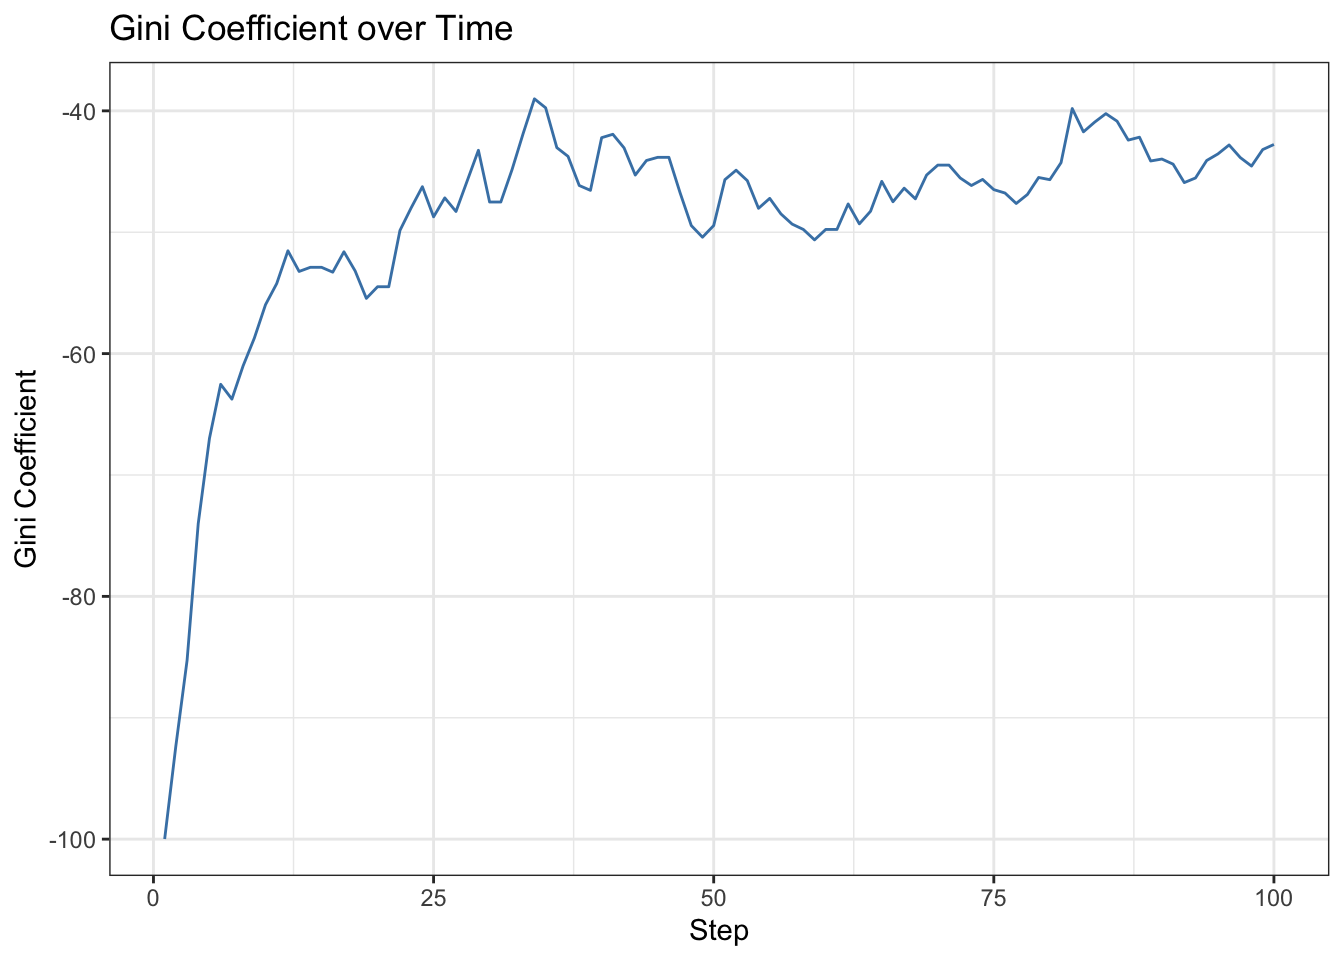
5.3 练习
5.3.1 仅显示数据以查看格式
py$gini %>%
  rownames_to_column("step") %>%
  mutate(step = as.numeric(step)) %>%
  head(6)
step Gini
1 1 -99.99
2 2 -92.31
3 3 -85.27
4 4 -73.97
5 5 -66.97
6 6 -62.535.3.2 增加 Agent 的数量和时间
5.3.2.1 增加数量
model = py$MoneyModel(400L, 20L, 20L, 1234L)
walk(1:100L, ~model$step())

gini_r = model$datacollector$get_model_vars_dataframe()  %>%
  rownames_to_column("step") %>% mutate(step = as.numeric(step))
gini_r %>%
  ggplot(aes(x = step, y = Gini)) +
  geom_line() +
  labs(
    title = "Gini Coefficient over Time",
    x     = "Step",
    y     = "Gini Coefficient"
  ) + theme_bw()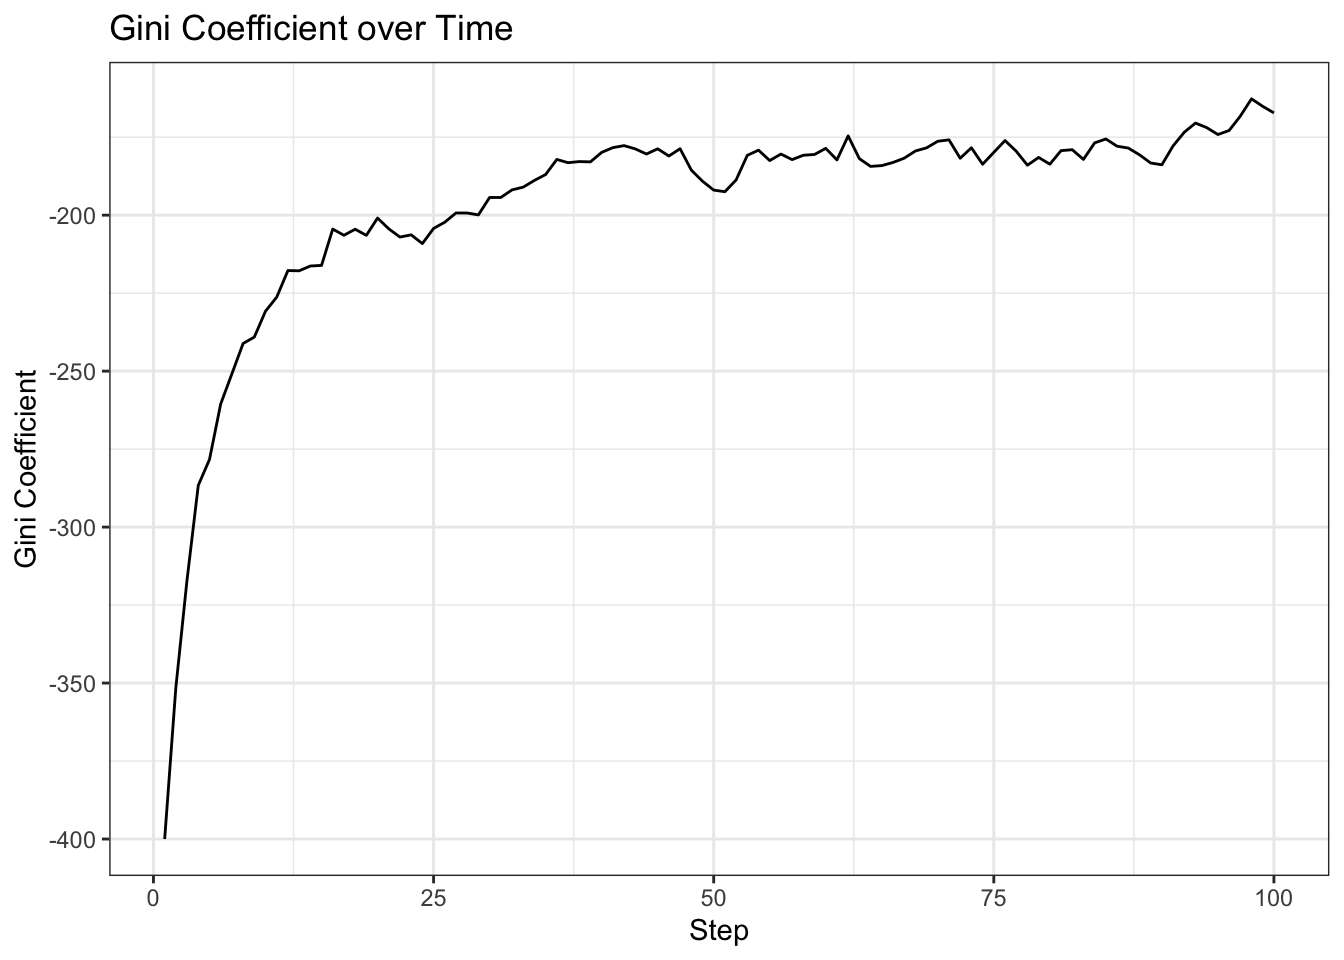
5.3.2.2 增加时间
model = py$MoneyModel(100L, 10L, 10L, 1234L)
walk(1:1000L, ~model$step())

gini_r = model$datacollector$get_model_vars_dataframe()  %>%
  rownames_to_column("step") %>% mutate(step = as.numeric(step))
gini_r %>%
  ggplot(aes(x = step, y = Gini)) +
  geom_line() +
  labs(
    title = "Gini Coefficient over Time",
    x     = "Step",
    y     = "Gini Coefficient"
  ) + theme_bw()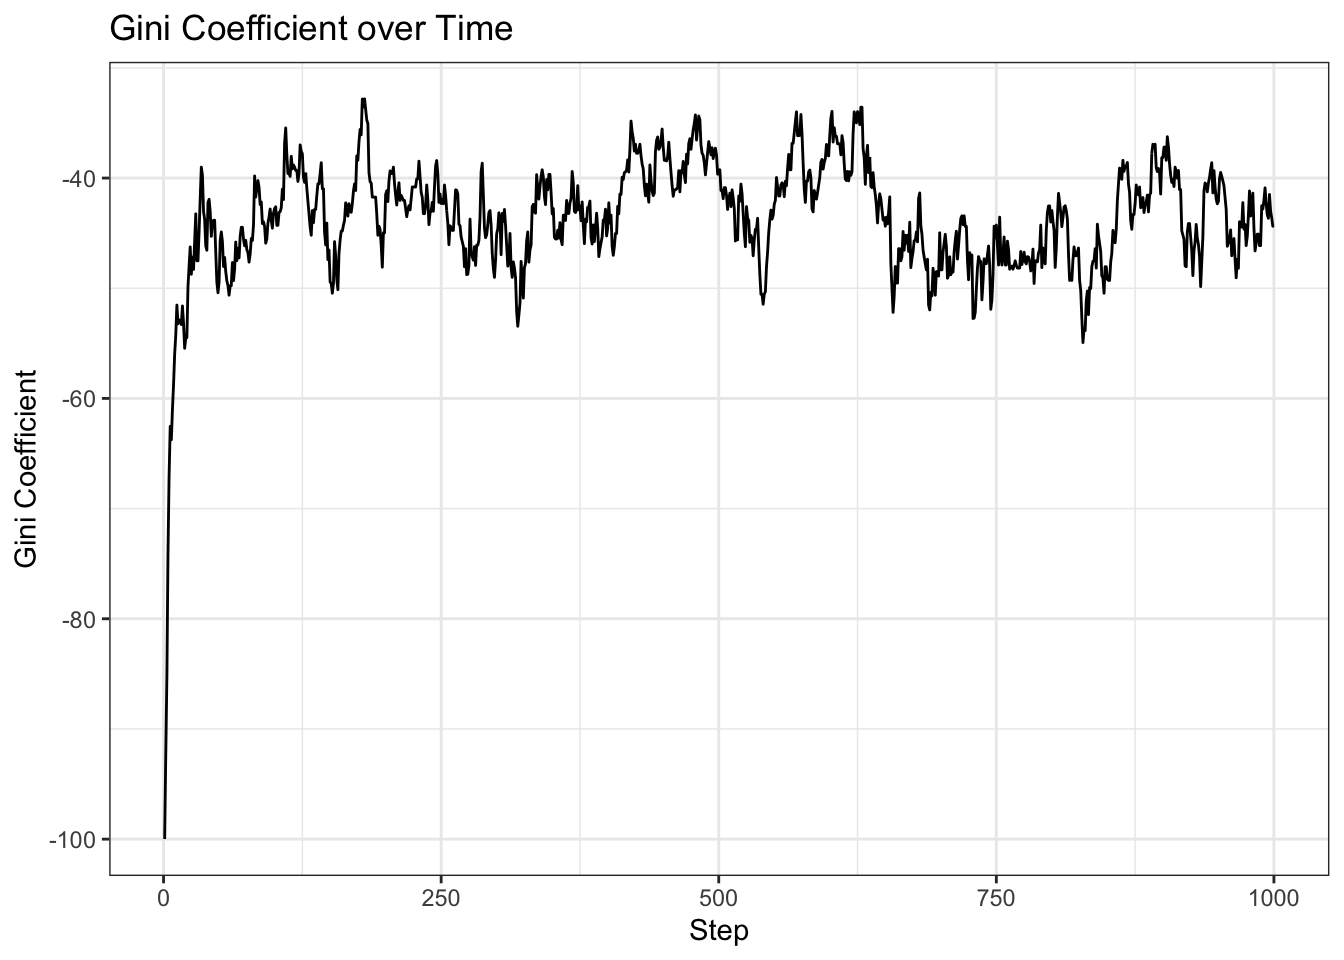
5.4 获取 agent_level 数据
绘制每个 Agent 在最后一步的财富分布。
agent_wealth = model.datacollector.get_agent_vars_dataframe()
agent_wealth.head()
Wealth
Step AgentID
1 1 1
2 1
3 1
4 1
5 1last_step = agent_wealth.index.get_level_values("Step").max()
end_wealth = agent_wealth.xs(last_step, level="Step")[
"Wealth"
]
g = sns.histplot(end_wealth, discrete=True)
g.set(
title="Distribution of wealth at the end of simulation",
xlabel="Wealth",
ylabel="number of agents",
);
plt.show()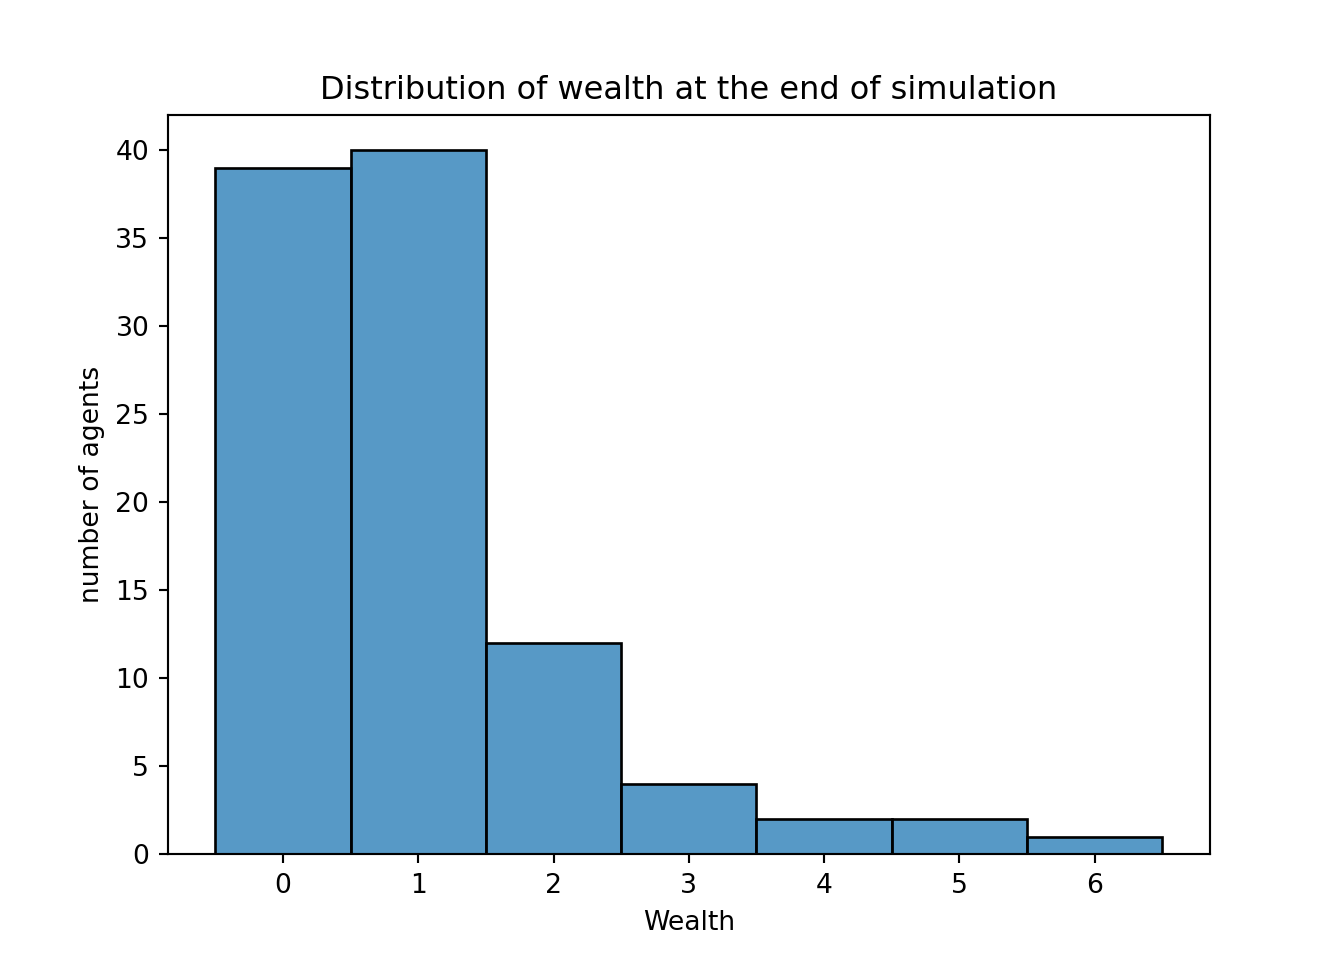
model = py$MoneyModel(100L, 10L, 10L, 1234L)
walk(1:100L, ~model$step())

# 这里有一点麻烦的是,numpy会建立一种多重索引的数据结构
# 转化为 R tibble 时会丢掉所有索引
# 但直接在 R 中 call
# py$model$datacollector$get_agent_vars_dataframe()$reset_index()
# 会出现问题,因此在 R 中进行了一次转换,!!!目前 reticulate 还没有提供更好的解决方法
agent_wealth <- model$datacollector$get_agent_vars_dataframe() %>%
  bind_cols(
  attributes(.)$pandas.index$to_frame() %>% py_to_r(),
  .
)

head(agent_wealth)
Step AgentID Wealth
1 1 1 1
2 1 2 1
3 1 3 1
4 1 4 1
5 1 5 1
6 1 6 1end_wealth = agent_wealth %>%
filter(Step == max(Step))
ggplot()+
geom_histogram(data = end_wealth, aes(Wealth),
binwidth = 1,
color = "black", fill="steelblue")+
ggtitle("Distribution of wealth at the end of simulation")+
xlab("Wealth")+
ylab("Number of agents")+
theme_bw()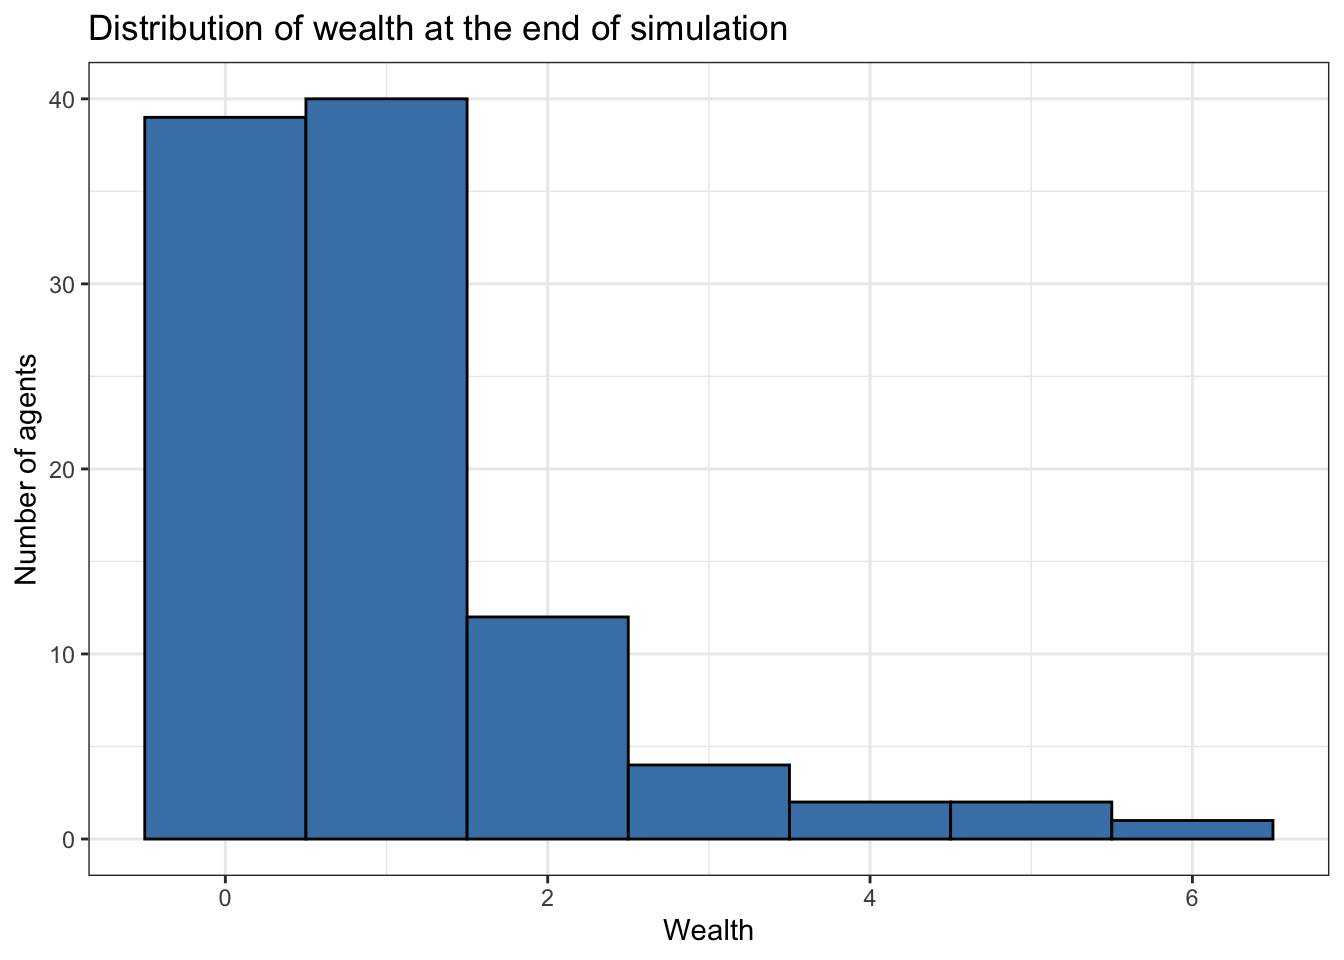
绘制 Agent 8 的财富变化。
agent_wealth %>% filter(AgentID == 8) %>%
  ggplot()+
  geom_line(aes(Step, Wealth),color = "steelblue")+
  ggtitle("Wealth of agent 8 over time")+
  theme_bw()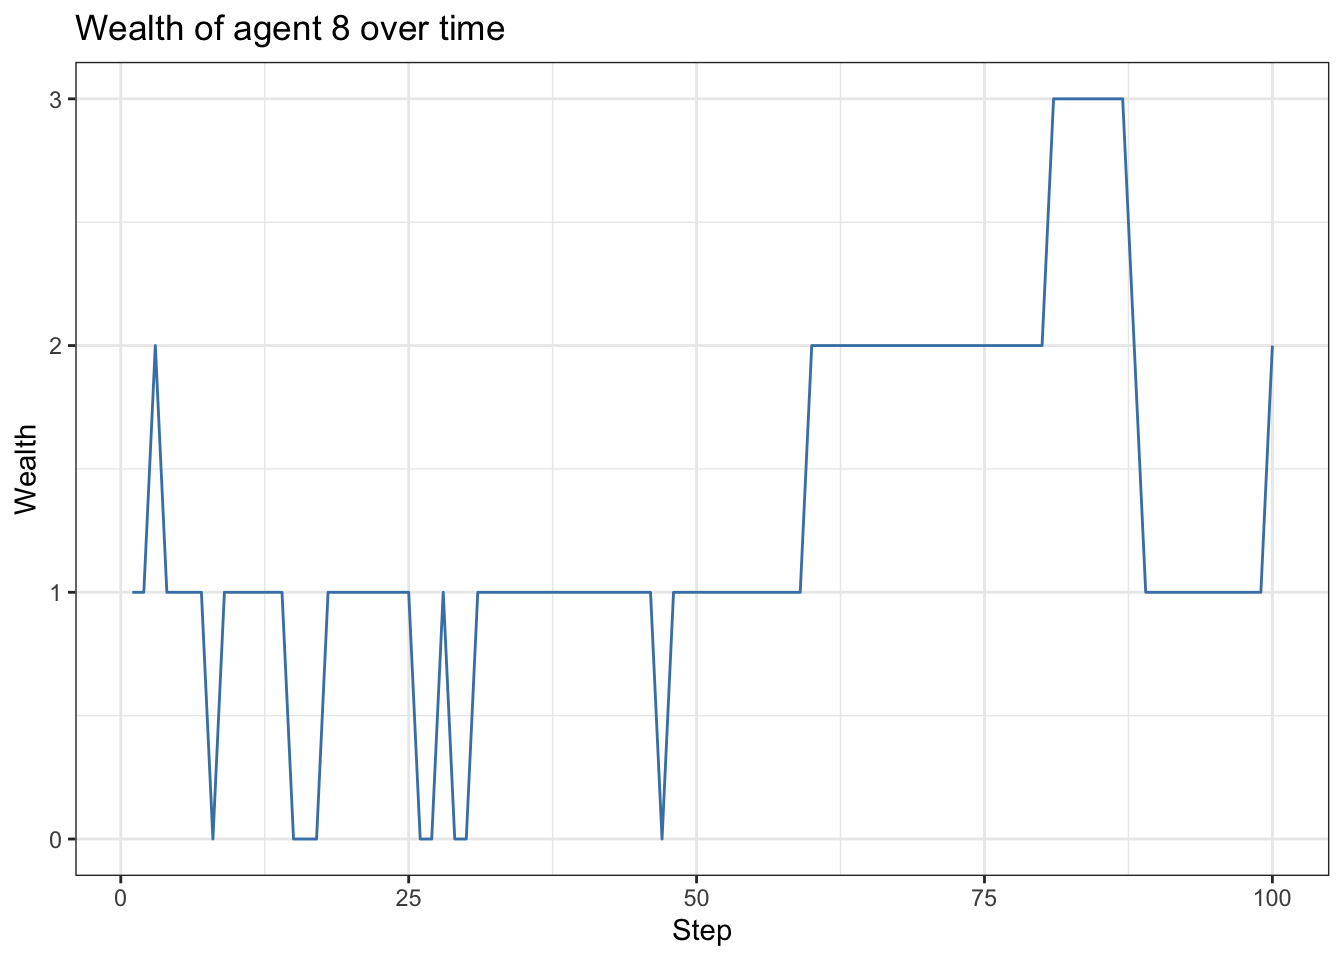
绘制多个 Agent 的财富变化。
agent_wealth %>% filter(AgentID %in% c(3, 14, 25)) %>%
  ggplot()+
  geom_line(aes(Step, Wealth,color = factor(AgentID)))+
  ggtitle("Wealth of agent 3, 4 and 25 over time")+
  theme_bw()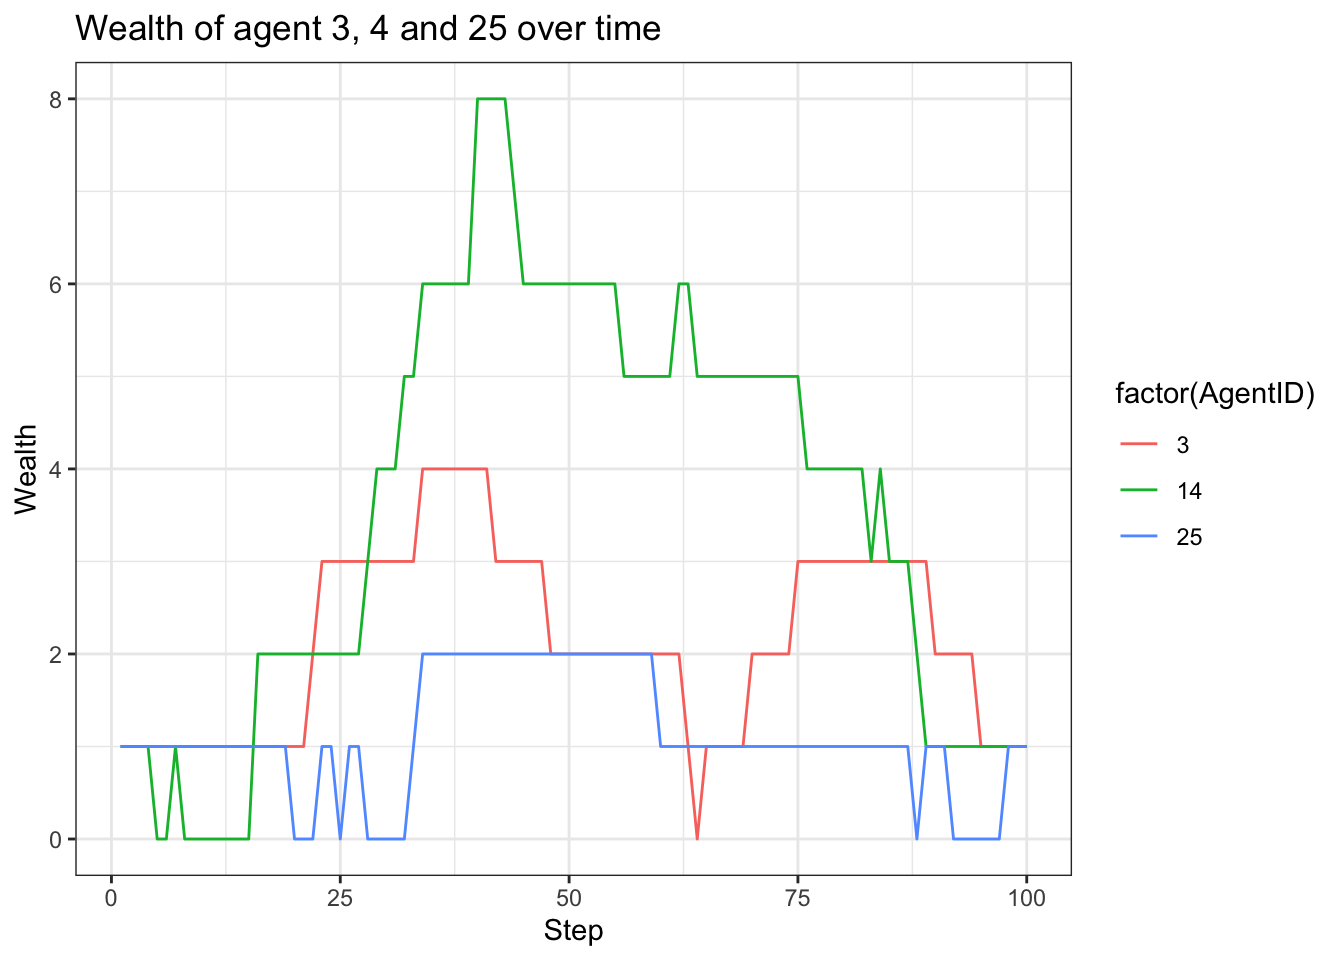
绘制所有 Agent 的财富的平均值和置信区间。
agent_wealth %>%
  group_by(Step) %>%
  summarise(mean = mean(Wealth),
            lower = mean(Wealth) - 1.96 * sd(Wealth)/sqrt(n()),
            upper = mean(Wealth) + 1.96 * sd(Wealth)/sqrt(n())) %>%
  ggplot()+
  geom_line(aes(Step, mean),color = "steelblue")+
  geom_ribbon(aes(Step, ymin = lower, ymax = upper),
              fill = "steelblue", alpha = 0.2)+
  ggtitle("Average wealth over time")+
  theme_bw()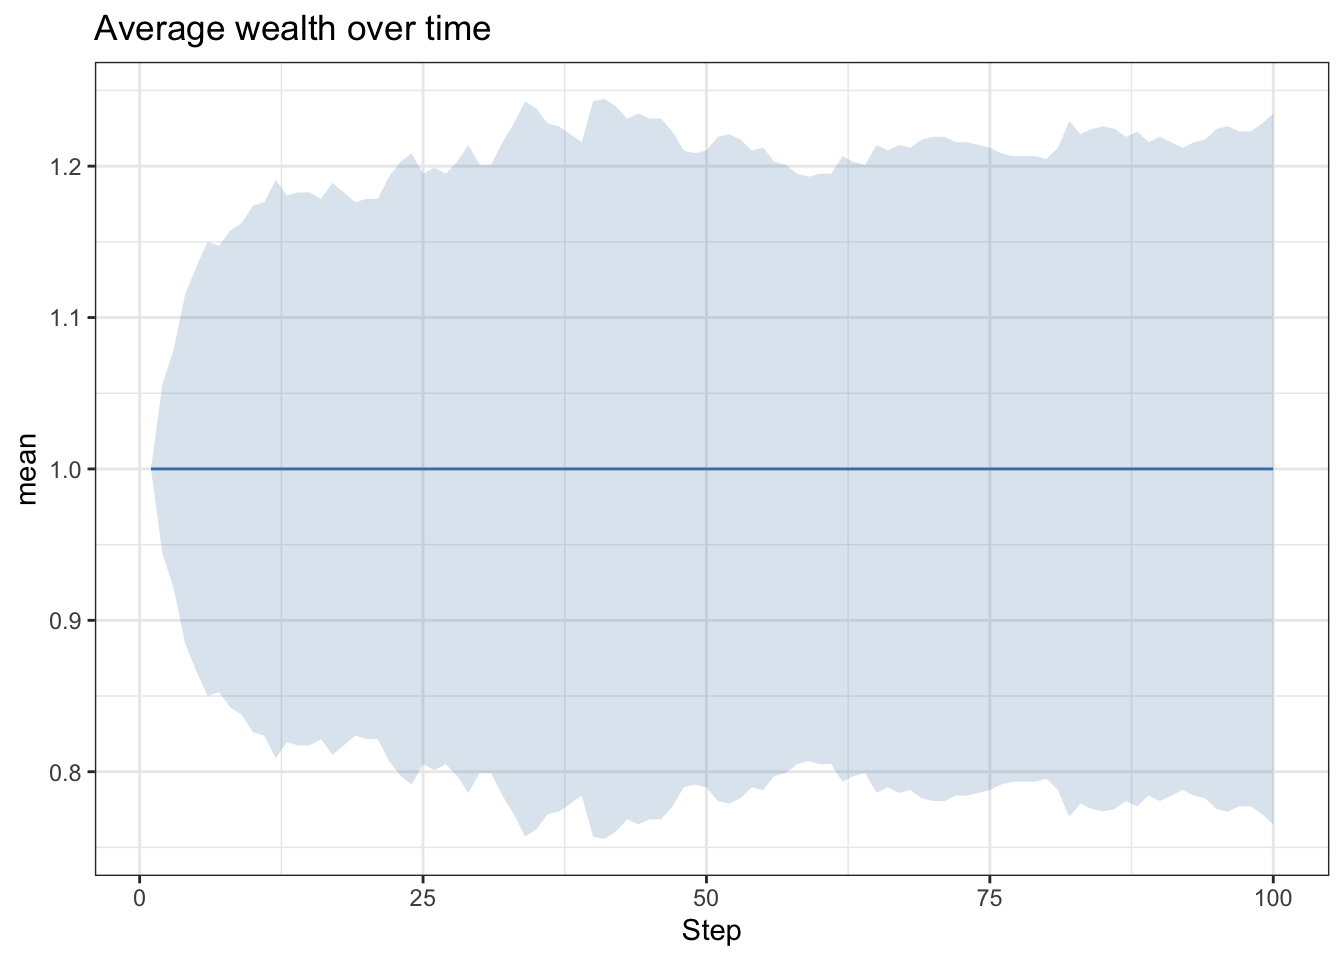
ggplot(agent_wealth, aes(x = Step, y = Wealth, group = 1)) +
  stat_summary(
    geom      = "ribbon",
    fun.data  = mean_cl_normal,
    fun.args  = list(conf.int = 0.95),
    fill      = "steelblue",
    alpha     = 0.2
  ) +
  stat_summary(
    geom = "line",
    fun  = mean,
    colour = "steelblue"
  ) +
  ggtitle("Average wealth over time") +
  theme_bw()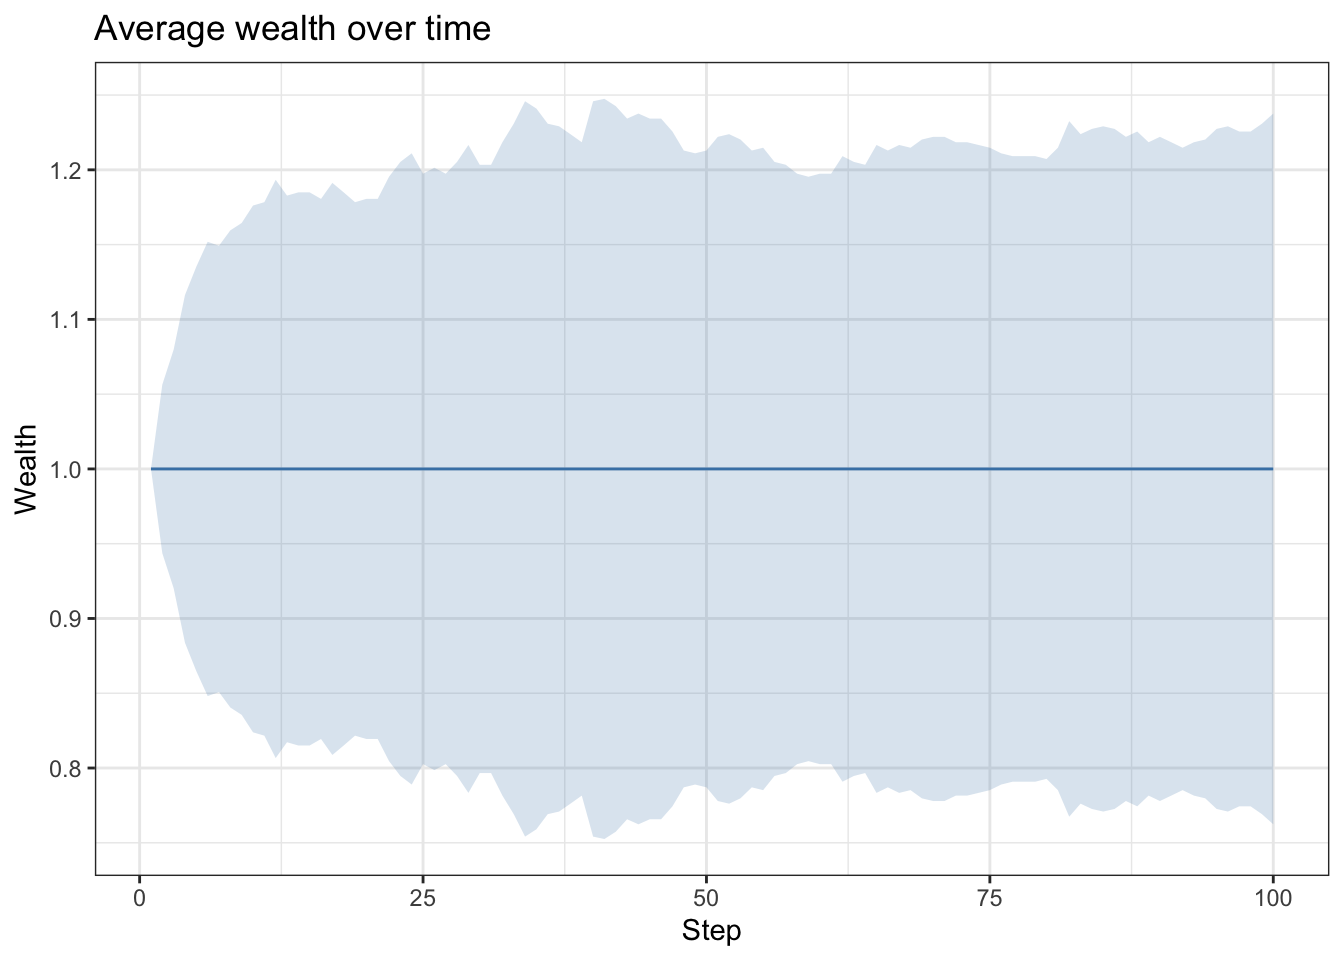
6 通过 AgentSet 管理 Agents
Mesa 使用基于集合的方法 AgentSet 来管理 Agents,但大多数情况下不会显式调用。
以下展示两种 Agent 管理方法:
选择(
Selecting):只让富裕的Agent给贫穷的Agent传递财富。分组(
GroupBy):根据财富将Agent分组。
6.1 选择
在这个模型变体中,将使用 agents.select 把 Agent 分为贫富两种。
def compute_gini(model):
    agent_wealths = [agent.wealth for agent in model.agents]
    x = sorted(agent_wealths)
    n = model.num_agents
    B = sum(xi * (n - i) for i, xi in enumerate(x)) / (n * sum(x))
    return 1 + (1 / n) - 2 * B


class MoneyAgent(mesa.Agent):
    """An agent with fixed initial wealth."""

    def __init__(self, model):
        super().__init__(model)
        self.wealth = 1
    # 在这里定义了只给poor_agents 传递财富
    def give_money(self, poor_agents):
        if self.wealth > 0:
            other_agent = self.random.choice(poor_agents)
            other_agent.wealth += 1
            self.wealth -= 1


class MoneyModel(mesa.Model):
    """A model with some number of agents."""

    def __init__(self, n):
        super().__init__()
        self.num_agents = n

        MoneyAgent.create_agents(model=self, n=n)

        self.datacollector = mesa.DataCollector(
            model_reporters={"Gini": compute_gini},
            agent_reporters={"Wealth": "wealth"}
        )

    def step(self):
        self.datacollector.collect(self)
        # 用 agent.select 获取贫富 Agent 的列表
        # 这里的 lambda 等于 R 的匿名函数 ~
        # 在原本的教程中,这里写作model.agents.select
        # 这在原生 python 环境中没有问题,因为在调用 model = MoneyModel(100) 时
        # 会创建全局变量 model,但在 R 中运行模型时,无法找到
        # 因此在这里改写成了更规范的 self.agents.select
        rich_agents = self.agents.select(lambda a: a.wealth >= 3)
        poor_agents = self.agents.select(lambda a: a.wealth < 3)
        # 当有富裕的 Agent 时,富裕的 Agent 给贫穷的 Agent 传递财富
        if len(rich_agents) > 0:
            rich_agents.shuffle_do("give_money", poor_agents)
        else:
            poor_agents.shuffle_do("give_money", poor_agents)
model = py$MoneyModel(100L)
walk(1:20L, ~model$step())
agent_wealth <- model$datacollector$get_agent_vars_dataframe() %>%
bind_cols(
attributes(.)$pandas.index$to_frame() %>% py_to_r(),
.
)
agent_wealth %>%
ggplot() +
geom_histogram(aes(Wealth), fill = "steelblue",binwidth = 1, color = "black") +
labs(
title = "Wealth distribution",
x = "Wealth",
y = "Number of agents"
) + theme_bw()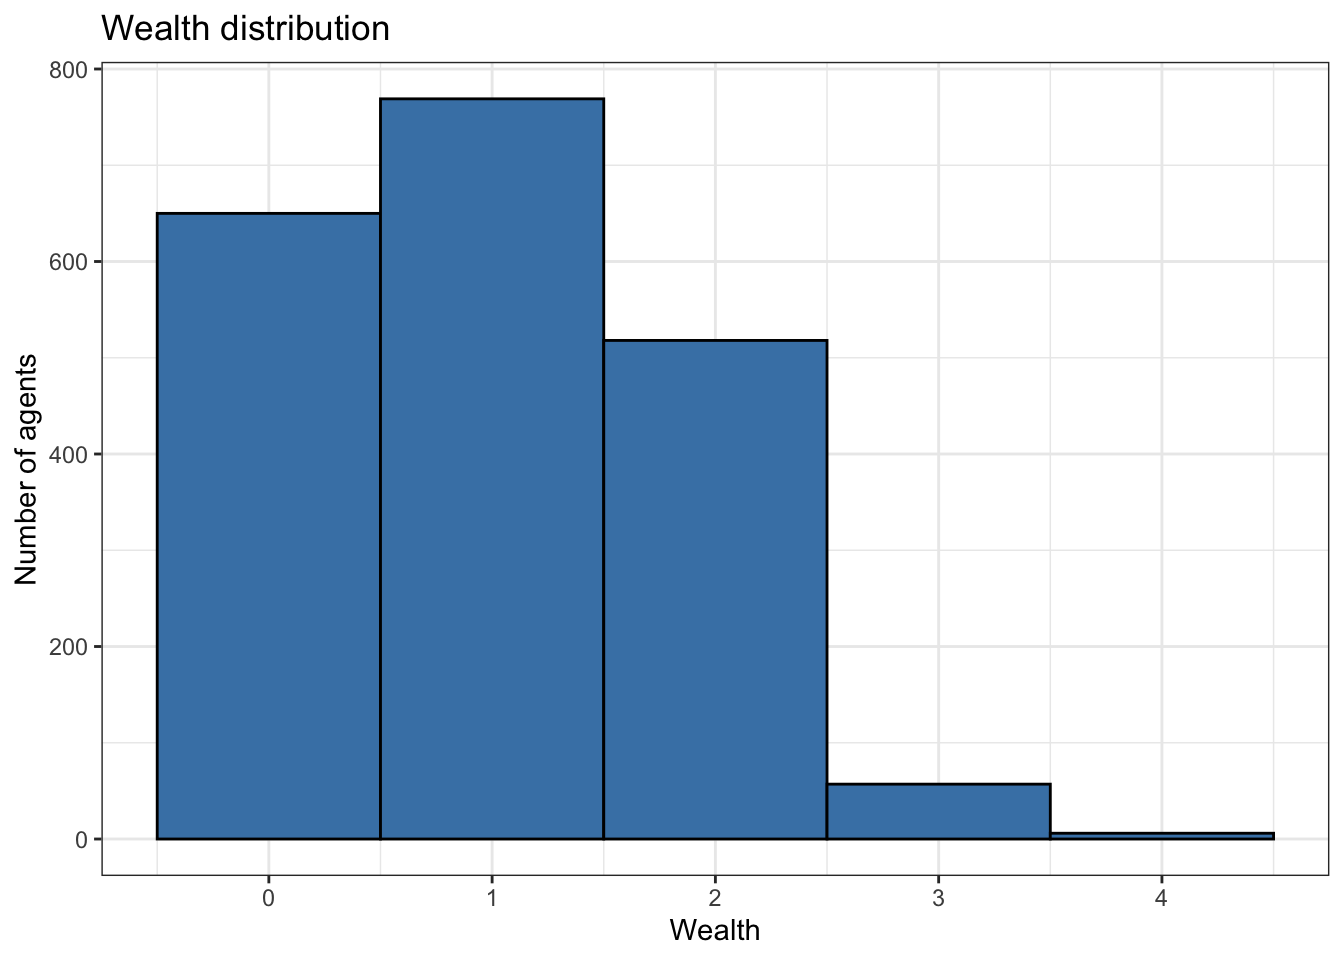
6.2 分组
通过一个 characteristics 将 Agent 分组, 例如提供 Green、Blue 和 Mixed 的种族属性,只在同种族内给钱。
def compute_gini(model):
    agent_wealths = [agent.wealth for agent in model.agents]
    x = sorted(agent_wealths)
    n = model.num_agents
    B = sum(xi * (n - i) for i, xi in enumerate(x)) / (n * sum(x))
    return 1 + (1 / n) - 2 * B

class MoneyAgent(mesa.Agent):
    """An agent with fixed initial wealth."""

    def __init__(self, model, ethnicity):
        super().__init__(model)
        self.wealth = 1
        # 定义 Agent 的种族
        self.ethnicity = ethnicity

    def give_money(self, similars):
        if self.wealth > 0:
            # 从同种族的 Agent 中随机选择一个
            other_agent = self.random.choice(similars)
            other_agent.wealth += 1
            self.wealth -= 1


class MoneyModel(mesa.Model):
    """A model with some number of agents."""

    def __init__(self, n):
        super().__init__()
        self.num_agents = n

        # 创建一个种族列表
        ethnicities = ["Green", "Blue", "Mixed"]

        MoneyAgent.create_agents(
            model=self,
            n=self.num_agents,
            # 从种族列表中随机选择种族
            ethnicity=self.random.choices(ethnicities, k=self.num_agents),
        )

        self.datacollector = mesa.DataCollector(
            model_reporters={"Gini": compute_gini},
            agent_reporters={"Wealth": "wealth", "Ethnicity": "ethnicity"},
        )

    def step(self):
        self.datacollector.collect(self)
        # 创建一个字典,存储 Agent 的种族
        grouped_agents = self.agents.groupby("ethnicity")
        for ethnic, similars in grouped_agents:
            if ethnic != "Mixed":
                similars.shuffle_do("give_money", similars)
            else:
                similars.shuffle_do(
                    "give_money", self.agents
                )  # Mixed 可以给所有人钱
model = py$MoneyModel(100L)
walk(1:20L, ~model$step())
agent_wealth <- model$datacollector$get_agent_vars_dataframe() %>%
bind_cols(
attributes(.)$pandas.index$to_frame() %>% py_to_r(),
.
)
agent_wealth %>%
ggplot()+
geom_histogram(aes(Wealth, fill = Ethnicity),binwidth = 1, color = "black")+
theme_bw()+
scale_fill_manual(values = c("Green" = "darkgreen",
"Blue" = "darkblue",
"Mixed" = "purple3")) +
labs(title = "Wealth distribution")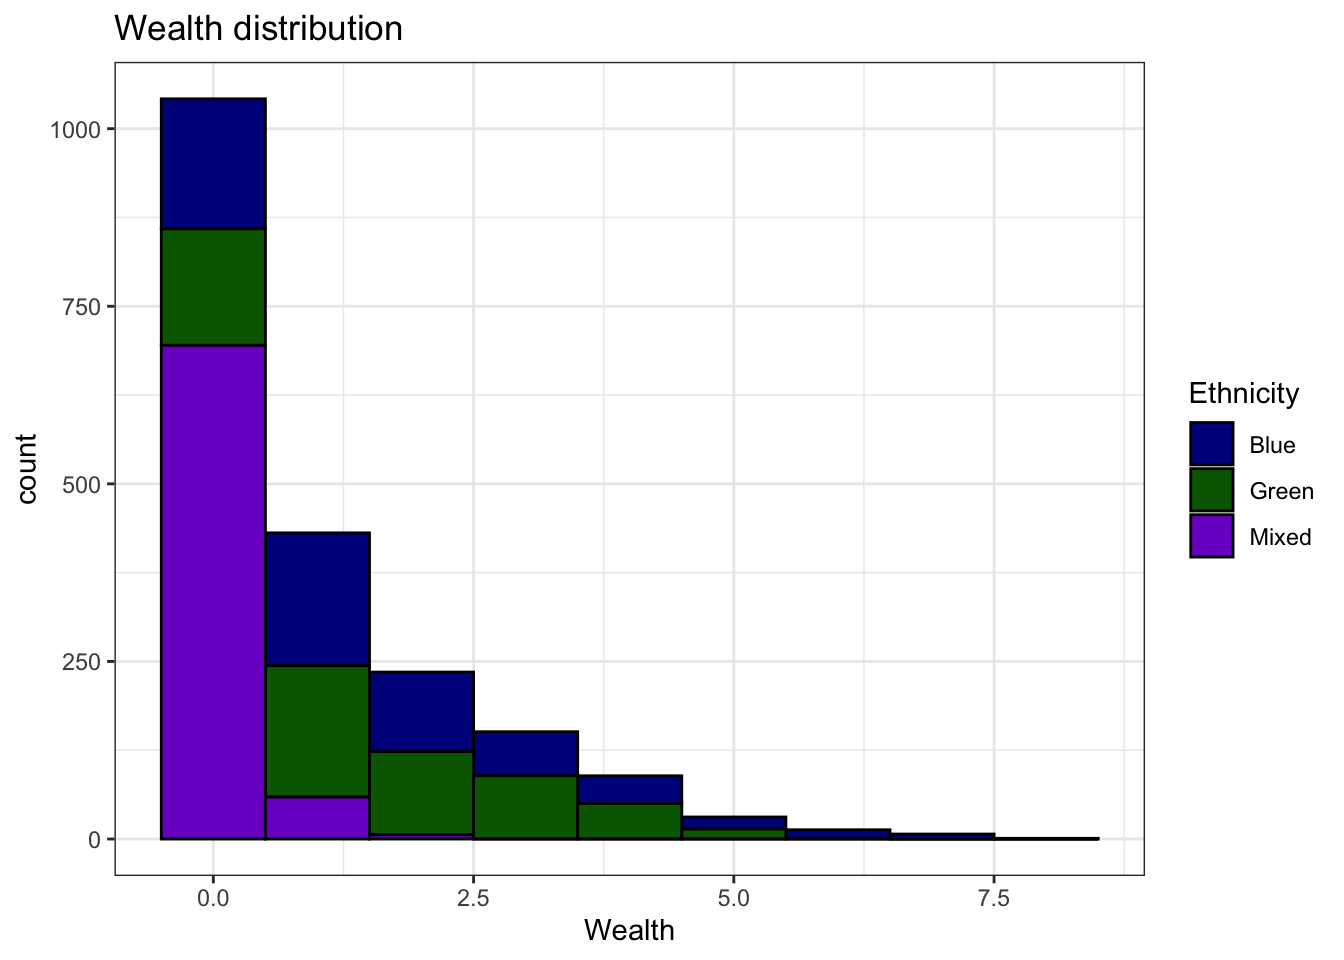
7 可视化
略,不需要可交互可视化,也许可以用 Shiny 在 R 中实现,但我不会。
8 参数扫描
8.1 基础模型
from mesa.discrete_space import CellAgent, OrthogonalMooreGrid
def compute_gini(model):
    agent_wealths = [agent.wealth for agent in model.agents]
    x = sorted(agent_wealths)
    n = model.num_agents
    B = sum(xi * (n - i) for i, xi in enumerate(x)) / (n * sum(x))
    return 1 + (1 / n) - 2 * B


class MoneyAgent(CellAgent):
    """An agent with fixed initial wealth."""

    def __init__(self, model, cell):
        super().__init__(model)
        self.cell = cell
        self.wealth = 1
        self.steps_not_given = 0

    def move(self):
        self.cell = self.cell.neighborhood.select_random_cell()

    def give_money(self):
        cellmates = [a for a in self.cell.agents if a is not self]

        if len(cellmates) > 0 and self.wealth > 0:
            other = self.random.choice(cellmates)
            other.wealth += 1
            self.wealth -= 1
            # 在这里增加了一个指示变量,如果一个 step 中没有给钱则+1
            self.steps_not_given = 0
        else:
            self.steps_not_given += 1


class MoneyModel(mesa.Model):
    """A model with some number of agents."""

    def __init__(self, n, width, height, seed=None):
        super().__init__(seed=seed)
        self.num_agents = n
        self.grid = OrthogonalMooreGrid(
            (width, height), torus=True, capacity=10, random=self.random
        )
        self.datacollector = mesa.DataCollector(
            model_reporters={"Gini": compute_gini},
            agent_reporters={"Wealth": "wealth", "Steps_not_given": "steps_not_given"},
        )
        self.running = True

        agents = MoneyAgent.create_agents(
            self,
            self.num_agents,
            self.random.choices(self.grid.all_cells.cells, k=self.num_agents),
        )

    def step(self):
        self.datacollector.collect(self)
        self.agents.shuffle_do("move")
        self.agents.do("give_money")
8.2 Batch 运行
mesa.batch_run 提供了一种批量运行模型的方式,可以在不同参数下运行模型,并收集结果。
在这里使用了 reticulate 包的另一种用法,即 import() Python 模块后直接调用其中的函数。
使用一个列表将需要的参数传递给模型,并指定迭代的次数 iterations。
mesa = import("mesa")
pd = import("pandas")
params = list(width = 10L, height = 10L, n = seq(5L, 100L, by = 5L))
results = mesa$batch_run(
    py$MoneyModel,
    parameters = params,
    iterations = 5L,
    max_steps = 100L,
    number_processes = 1L,
    data_collection_period = 1L,
    display_progress = TRUE
)
results_df = pd$DataFrame(results) %>% tibble()
results_df
# A tibble: 525,100 × 10
RunId iteration Step width height n Gini AgentID Wealth Steps_not_given
<dbl> <dbl> <dbl> <dbl> <dbl> <dbl> <dbl> <dbl> <dbl> <dbl>
1 0 0 0 10 10 5 0 NaN NaN NaN
2 0 0 1 10 10 5 0 1 1 0
3 0 0 1 10 10 5 0 2 1 0
4 0 0 1 10 10 5 0 3 1 0
5 0 0 1 10 10 5 0 4 1 0
6 0 0 1 10 10 5 0 5 1 0
7 0 0 2 10 10 5 0 1 1 1
8 0 0 2 10 10 5 0 2 1 1
9 0 0 2 10 10 5 0 3 1 1
10 0 0 2 10 10 5 0 4 1 1
# ℹ 525,090 more rows可视化基尼系数分布。
由于每个群体内的基尼系数相同,因此选择一个 Agent 即可。
由于设置了 iterations 为 5,因此每个 n 的值会有 5 个结果。
results_df %>%
  filter(AgentID == 1 & Step == max(Step)) %>%
  ggplot(aes(x = n, y = Gini)) +
  geom_point(color = "steelblue") +
  labs(
    title = "Gini Coefficient vs. Number of Agents",
    x     = "Number of Agents",
    y     = "Gini Coefficient"
  ) + theme_bw()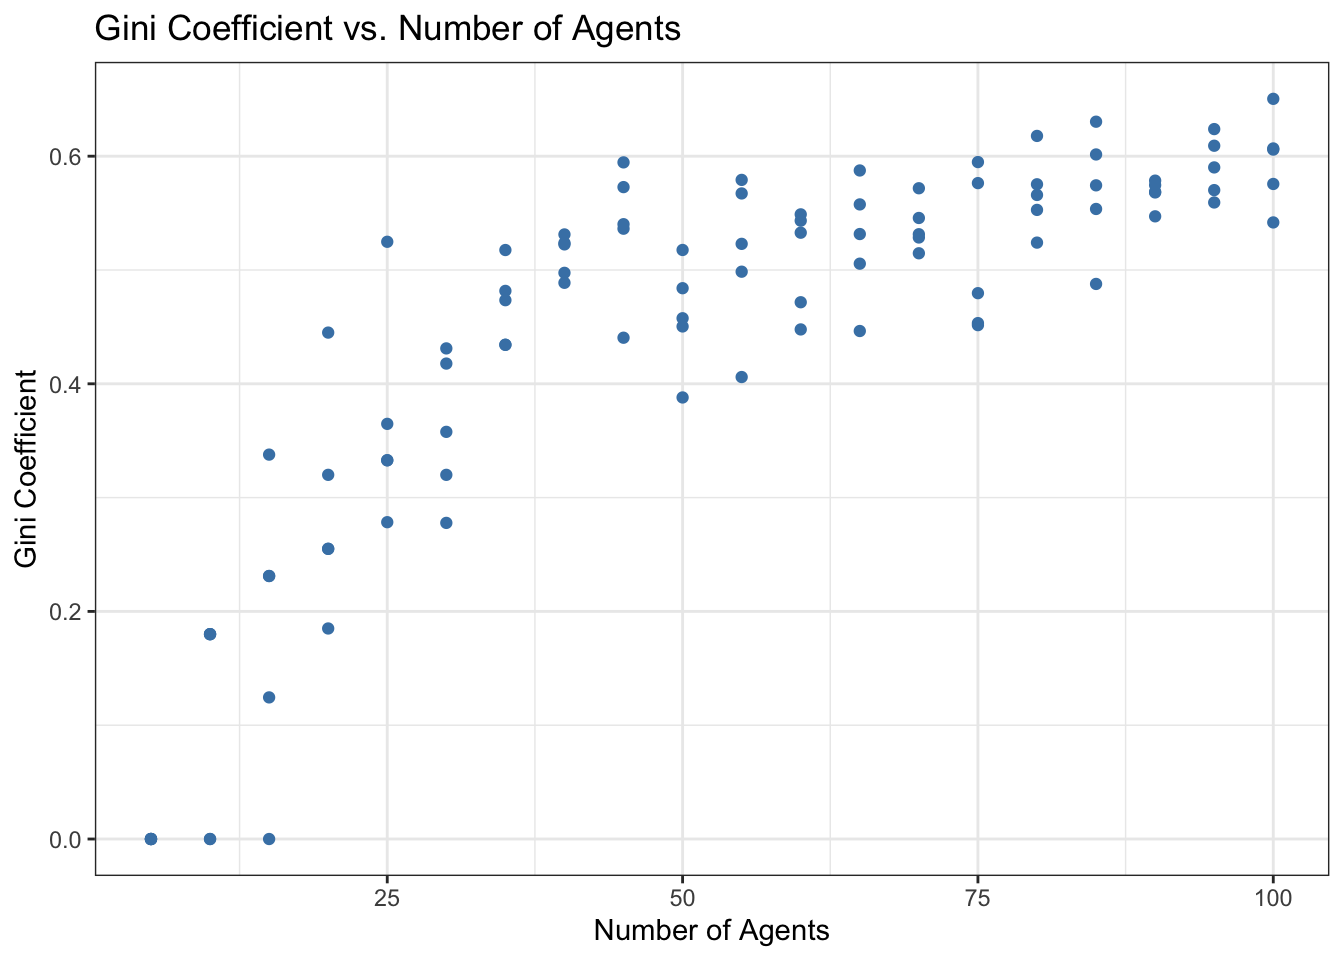
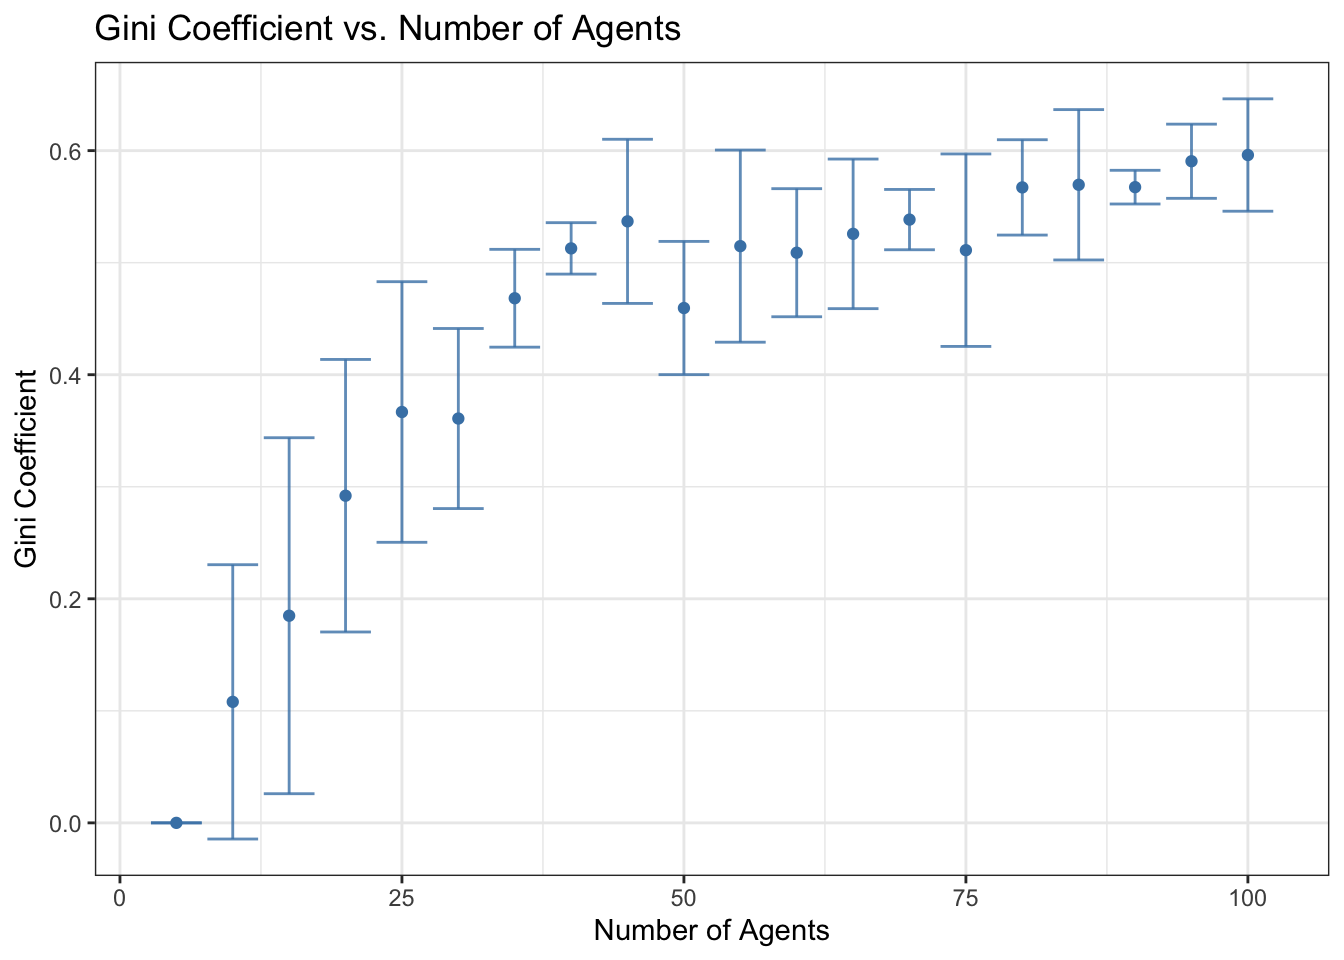
或者绘制误差条。
results_df %>%
  filter(AgentID == 1 & Step == max(Step)) %>%
  ggplot(aes(x = n, y = Gini)) +
  stat_summary(
    geom      = "errorbar",
    fun.data  = mean_cl_normal,
    fun.args  = list(conf.int = 0.95),
    color      = "steelblue",
    alpha     = 0.8
  ) +
  stat_summary(
    geom = "point",
    fun  = mean,
    colour = "steelblue"
  ) +
  theme_bw()+
  labs(
    title = "Gini Coefficient vs. Number of Agents",
    x     = "Number of Agents",
    y     = "Gini Coefficient"
  )
9 比较方案
我们可以比较 25 个 Agent 和 400 个 Agent 的基尼系数的不同,为了更好地估计不确定性,将 iterations 设置为 25。
此外,种子对 ABM 的运行非常重要,ABM 通常具有固有的随机性,种子在以下两个方面至关重要。
可重复性(
Reproducibility):使用相同的种子可以确保每次运行模型时都能得到相同的结果。敏感性分析(
Sensitivity Analysis):确定模型结果对随机波动对稳健性。
将种子视为一个附加参数并运行许多场景,使我们能够看到随机性对这个模型的影响。
params = list(seed = NULL, width = 10L, height = 10L, n = list(5L, 10L, 20L, 40L, 80L))
results_5s = mesa$batch_run(
    py$MoneyModel,
    parameters = params,
    iterations = 25L,
    max_steps = 100L,
    number_processes = 1L,
    data_collection_period = 1L,
    display_progress = TRUE
)
results_5s_df = pd$DataFrame(results_5s)
results_5s_df_filtered = results_5s_df %>%
filter(AgentID == 1)
head(results_5s_df_filtered) RunId iteration Step seed width height n Gini AgentID Wealth Steps_not_given
1 0 0 1 <NA> 10 10 5 0 1 1 0
2 0 0 2 <NA> 10 10 5 0 1 1 0
3 0 0 3 <NA> 10 10 5 0 1 1 1
4 0 0 4 <NA> 10 10 5 0 1 1 2
5 0 0 5 <NA> 10 10 5 0 1 1 3
6 0 0 6 <NA> 10 10 5 0 1 1 4results_5s_df%>%
ggplot(aes(x = Step, y = Gini)) +
stat_summary(
aes(fill = factor(n)),
geom = "ribbon",
fun.data = mean_cl_normal,
fun.args = list(conf.int = 0.95),
alpha = 0.2
) +
stat_summary(
aes(color= factor(n)),
geom = "line",
fun = mean
) +
labs(
title = "Gini coefficient for different population sizes\n(mean over 100 runs, with 95% confidence interval)",
y = "Gini Coefficient"
) + theme_bw()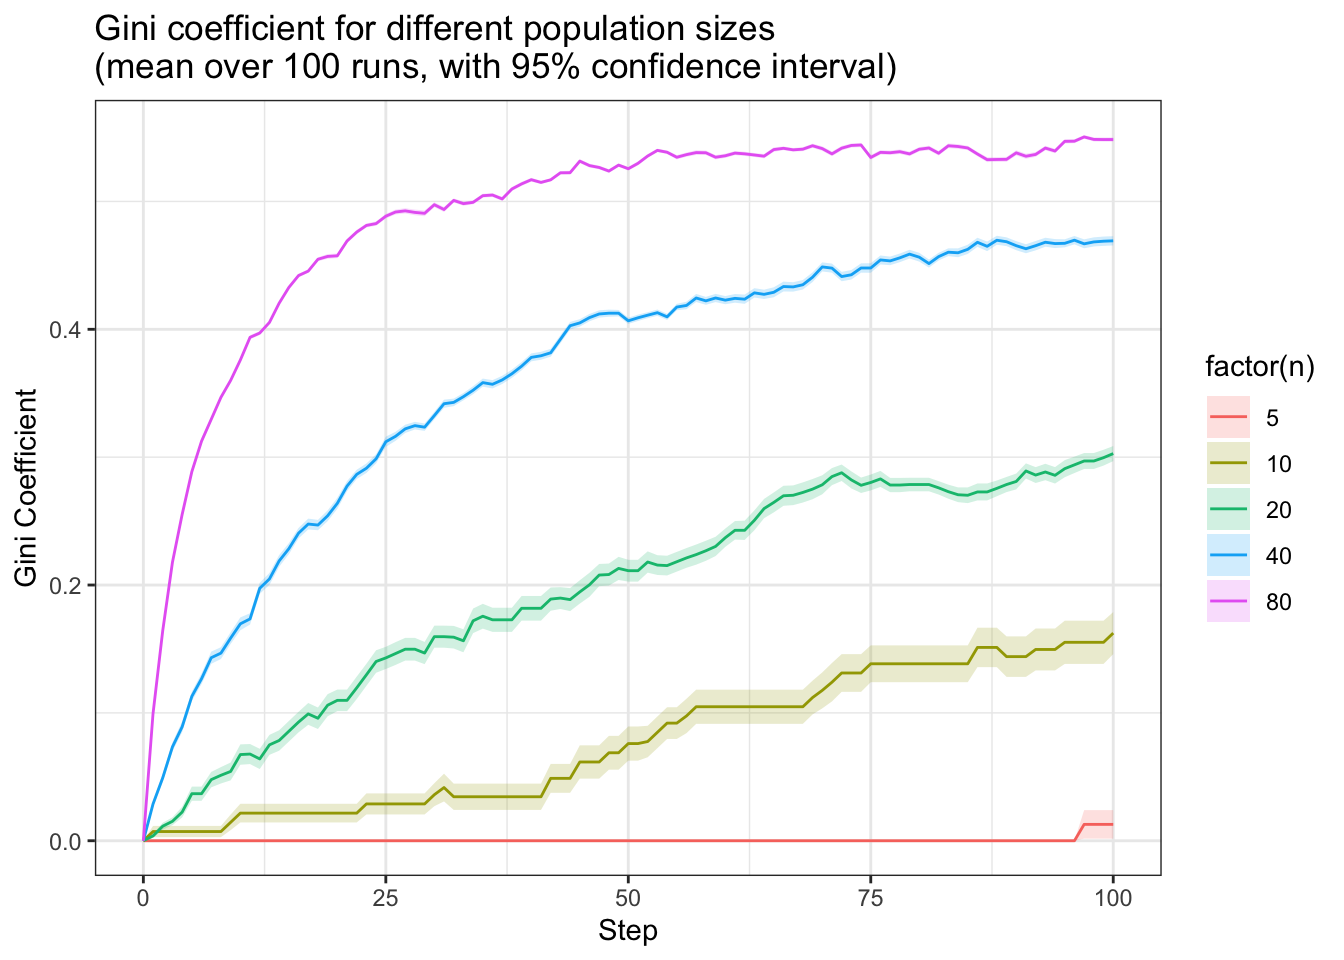
可见,较小的群体,基尼系数增长较慢。
下面将比较不同种群大小的没有交易的平均轮数。
results_5s_df %>% filter(Step != 0) %>%
  group_by(iteration, n, Step) %>%
  summarise(mean_wealth = mean(Wealth),
            mean_steps_not_given = mean(Steps_not_given)) %>%
  ungroup() %>%
  ggplot(aes(x = Step, y = mean_steps_not_given)) +
  stat_summary(
    aes(fill = factor (n)),
    geom      = "ribbon",
    fun.data  = mean_cl_normal,
    fun.args  = list(conf.int = 0.95),
    alpha     = 0.2
  )+
  stat_summary(
    aes(color = factor(n)),
    geom = "line",
    fun  = mean
  )+
  theme_bw()+
  labs(
    title = "Average number of consecutive rounds without a transaction for different population sizes\n(mean with 95% confidence interval)",
    y     = "Consecutive rounds without a transaction"
  )
`summarise()` has grouped output by 'iteration', 'n'. You can override using
the `.groups` argument.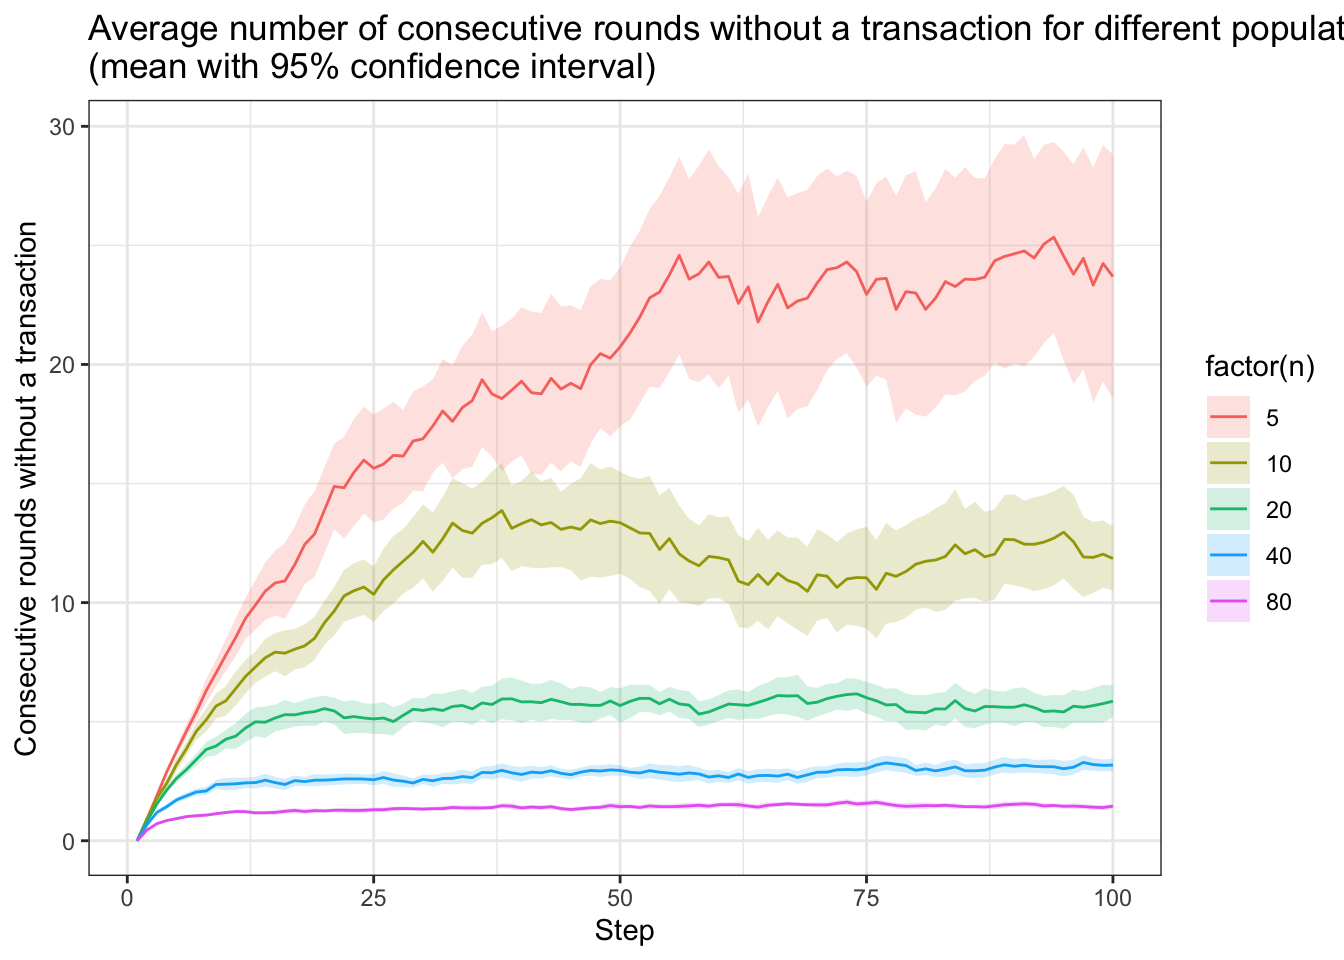
可见, 越小的群体,连续无交易的回合越多,因为 Agent 互动较少,财富不太会变化。